White/Caucasian vs Bahamian Unemployment Among Seniors over 65 years
COMPARE
White/Caucasian
Bahamian
Unemployment Among Seniors over 65 years
Unemployment Among Seniors over 65 years Comparison
Whites/Caucasians
Bahamians
5.1%
UNEMPLOYMENT AMONG SENIORS OVER 65 YEARS
84.4/ 100
METRIC RATING
136th/ 347
METRIC RANK
5.3%
UNEMPLOYMENT AMONG SENIORS OVER 65 YEARS
0.9/ 100
METRIC RATING
242nd/ 347
METRIC RANK
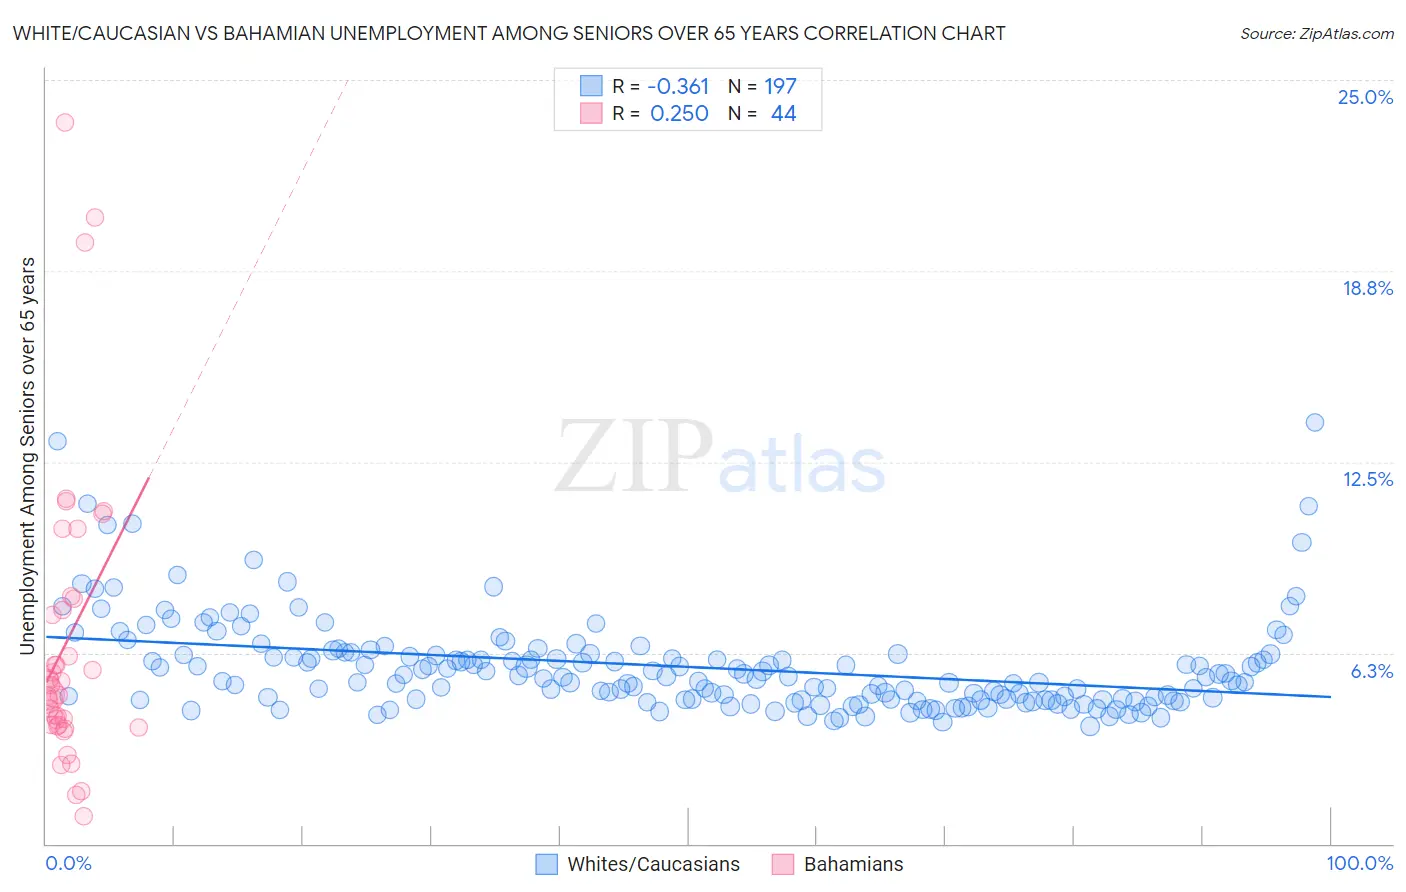
White/Caucasian vs Bahamian Unemployment Among Seniors over 65 years Correlation Chart
The statistical analysis conducted on geographies consisting of 465,209,584 people shows a mild negative correlation between the proportion of Whites/Caucasians and unemployment rate amomg seniors over the age of 65 in the United States with a correlation coefficient (R) of -0.361 and weighted average of 5.1%. Similarly, the statistical analysis conducted on geographies consisting of 107,457,827 people shows a weak positive correlation between the proportion of Bahamians and unemployment rate amomg seniors over the age of 65 in the United States with a correlation coefficient (R) of 0.250 and weighted average of 5.3%, a difference of 5.2%.
Unemployment Among Seniors over 65 years Correlation Summary
| Measurement | White/Caucasian | Bahamian |
| Minimum | 3.9% | 0.90% |
| Maximum | 13.8% | 23.6% |
| Range | 9.9% | 22.7% |
| Mean | 5.8% | 6.6% |
| Median | 5.5% | 5.0% |
| Interquartile 25% (IQ1) | 4.7% | 3.9% |
| Interquartile 75% (IQ3) | 6.2% | 7.8% |
| Interquartile Range (IQR) | 1.5% | 3.9% |
| Standard Deviation (Sample) | 1.6% | 4.8% |
| Standard Deviation (Population) | 1.6% | 4.8% |
Similar Demographics by Unemployment Among Seniors over 65 years
Demographics Similar to Whites/Caucasians by Unemployment Among Seniors over 65 years
In terms of unemployment among seniors over 65 years, the demographic groups most similar to Whites/Caucasians are Ukrainian (5.1%, a difference of 0.0%), Arab (5.1%, a difference of 0.0%), Turkish (5.1%, a difference of 0.030%), Syrian (5.1%, a difference of 0.060%), and New Zealander (5.1%, a difference of 0.070%).
| Demographics | Rating | Rank | Unemployment Among Seniors over 65 years |
| Immigrants | England | 86.7 /100 | #129 | Excellent 5.1% |
| Iranians | 86.6 /100 | #130 | Excellent 5.1% |
| Immigrants | Australia | 85.8 /100 | #131 | Excellent 5.1% |
| Chileans | 85.6 /100 | #132 | Excellent 5.1% |
| Syrians | 85.3 /100 | #133 | Excellent 5.1% |
| Turks | 84.9 /100 | #134 | Excellent 5.1% |
| Ukrainians | 84.4 /100 | #135 | Excellent 5.1% |
| Whites/Caucasians | 84.4 /100 | #136 | Excellent 5.1% |
| Arabs | 84.3 /100 | #137 | Excellent 5.1% |
| New Zealanders | 83.2 /100 | #138 | Excellent 5.1% |
| Immigrants | Panama | 83.0 /100 | #139 | Excellent 5.1% |
| Immigrants | Chile | 83.0 /100 | #140 | Excellent 5.1% |
| Cherokee | 81.6 /100 | #141 | Excellent 5.1% |
| Immigrants | Indonesia | 81.0 /100 | #142 | Excellent 5.1% |
| Senegalese | 80.4 /100 | #143 | Excellent 5.1% |
Demographics Similar to Bahamians by Unemployment Among Seniors over 65 years
In terms of unemployment among seniors over 65 years, the demographic groups most similar to Bahamians are Nigerian (5.3%, a difference of 0.030%), Peruvian (5.3%, a difference of 0.13%), Ottawa (5.3%, a difference of 0.13%), Colombian (5.3%, a difference of 0.16%), and Immigrants from Caribbean (5.3%, a difference of 0.20%).
| Demographics | Rating | Rank | Unemployment Among Seniors over 65 years |
| Immigrants | Albania | 2.7 /100 | #235 | Tragic 5.3% |
| Immigrants | Costa Rica | 2.1 /100 | #236 | Tragic 5.3% |
| Immigrants | Greece | 2.0 /100 | #237 | Tragic 5.3% |
| Immigrants | Israel | 2.0 /100 | #238 | Tragic 5.3% |
| Immigrants | Senegal | 1.8 /100 | #239 | Tragic 5.3% |
| Immigrants | Trinidad and Tobago | 1.6 /100 | #240 | Tragic 5.3% |
| Apache | 1.3 /100 | #241 | Tragic 5.3% |
| Bahamians | 0.9 /100 | #242 | Tragic 5.3% |
| Nigerians | 0.9 /100 | #243 | Tragic 5.3% |
| Peruvians | 0.8 /100 | #244 | Tragic 5.3% |
| Ottawa | 0.8 /100 | #245 | Tragic 5.3% |
| Colombians | 0.7 /100 | #246 | Tragic 5.3% |
| Immigrants | Caribbean | 0.7 /100 | #247 | Tragic 5.3% |
| French Canadians | 0.7 /100 | #248 | Tragic 5.4% |
| Immigrants | Immigrants | 0.6 /100 | #249 | Tragic 5.4% |