Slovene vs Bahamian Unemployment Among Seniors over 65 years
COMPARE
Slovene
Bahamian
Unemployment Among Seniors over 65 years
Unemployment Among Seniors over 65 years Comparison
Slovenes
Bahamians
4.8%
UNEMPLOYMENT AMONG SENIORS OVER 65 YEARS
100.0/ 100
METRIC RATING
32nd/ 347
METRIC RANK
5.3%
UNEMPLOYMENT AMONG SENIORS OVER 65 YEARS
0.9/ 100
METRIC RATING
242nd/ 347
METRIC RANK
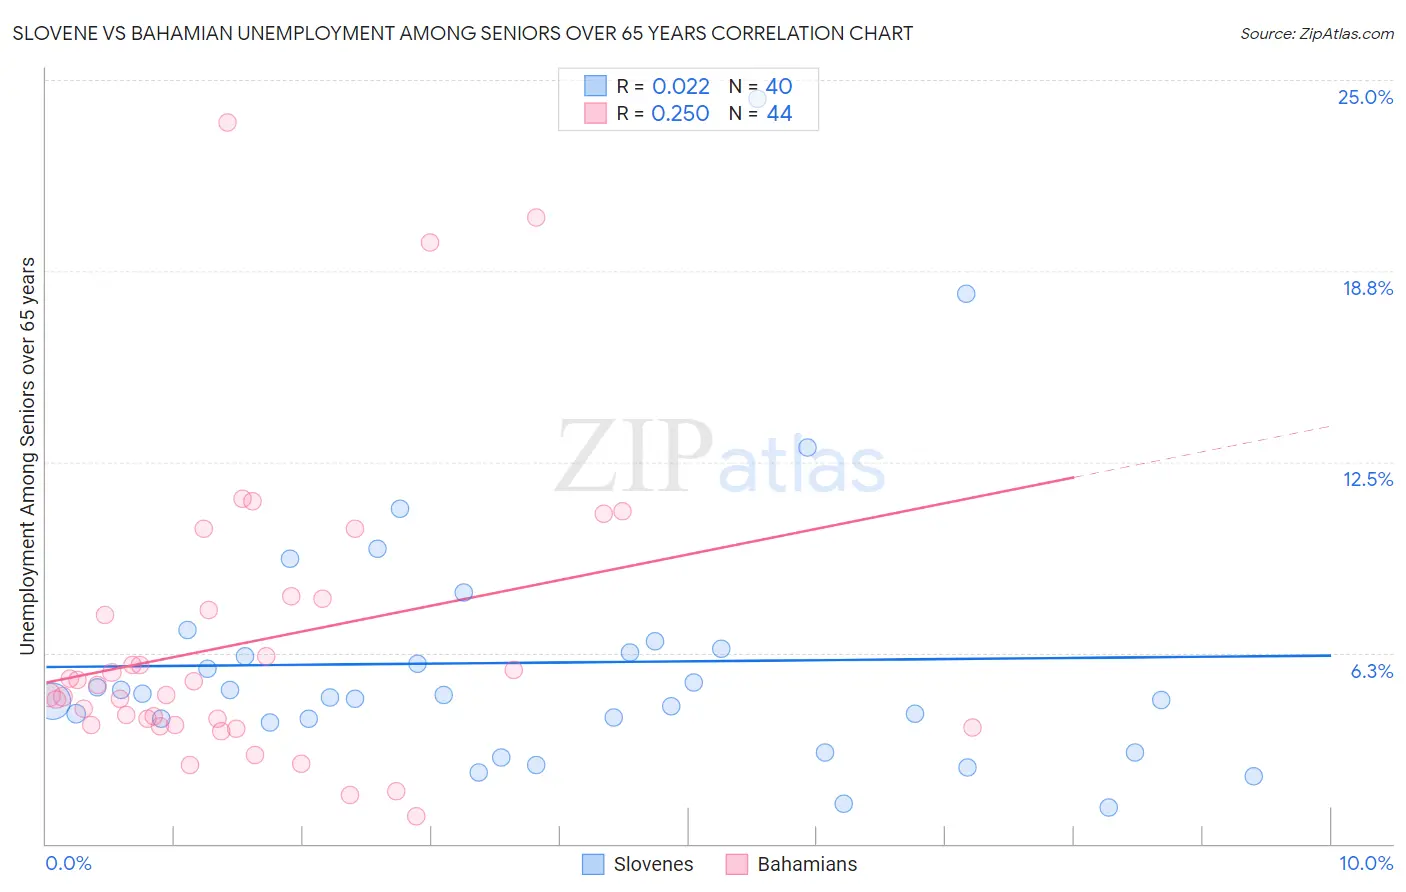
Slovene vs Bahamian Unemployment Among Seniors over 65 years Correlation Chart
The statistical analysis conducted on geographies consisting of 240,159,101 people shows no correlation between the proportion of Slovenes and unemployment rate amomg seniors over the age of 65 in the United States with a correlation coefficient (R) of 0.022 and weighted average of 4.8%. Similarly, the statistical analysis conducted on geographies consisting of 107,457,827 people shows a weak positive correlation between the proportion of Bahamians and unemployment rate amomg seniors over the age of 65 in the United States with a correlation coefficient (R) of 0.250 and weighted average of 5.3%, a difference of 11.1%.
Unemployment Among Seniors over 65 years Correlation Summary
| Measurement | Slovene | Bahamian |
| Minimum | 1.2% | 0.90% |
| Maximum | 24.4% | 23.6% |
| Range | 23.2% | 22.7% |
| Mean | 5.9% | 6.6% |
| Median | 4.8% | 5.0% |
| Interquartile 25% (IQ1) | 4.0% | 3.9% |
| Interquartile 75% (IQ3) | 6.3% | 7.8% |
| Interquartile Range (IQR) | 2.3% | 3.9% |
| Standard Deviation (Sample) | 4.4% | 4.8% |
| Standard Deviation (Population) | 4.3% | 4.8% |
Similar Demographics by Unemployment Among Seniors over 65 years
Demographics Similar to Slovenes by Unemployment Among Seniors over 65 years
In terms of unemployment among seniors over 65 years, the demographic groups most similar to Slovenes are Immigrants from Uganda (4.8%, a difference of 0.0%), Palestinian (4.8%, a difference of 0.090%), Belgian (4.8%, a difference of 0.21%), Bhutanese (4.8%, a difference of 0.43%), and Immigrants from Kuwait (4.8%, a difference of 0.45%).
| Demographics | Rating | Rank | Unemployment Among Seniors over 65 years |
| Tongans | 100.0 /100 | #25 | Exceptional 4.7% |
| Immigrants | Lebanon | 100.0 /100 | #26 | Exceptional 4.8% |
| Houma | 100.0 /100 | #27 | Exceptional 4.8% |
| Ugandans | 100.0 /100 | #28 | Exceptional 4.8% |
| Immigrants | North Macedonia | 100.0 /100 | #29 | Exceptional 4.8% |
| Belgians | 100.0 /100 | #30 | Exceptional 4.8% |
| Immigrants | Uganda | 100.0 /100 | #31 | Exceptional 4.8% |
| Slovenes | 100.0 /100 | #32 | Exceptional 4.8% |
| Palestinians | 100.0 /100 | #33 | Exceptional 4.8% |
| Bhutanese | 100.0 /100 | #34 | Exceptional 4.8% |
| Immigrants | Kuwait | 100.0 /100 | #35 | Exceptional 4.8% |
| Cambodians | 100.0 /100 | #36 | Exceptional 4.8% |
| Bulgarians | 99.9 /100 | #37 | Exceptional 4.8% |
| Immigrants | India | 99.9 /100 | #38 | Exceptional 4.8% |
| Macedonians | 99.9 /100 | #39 | Exceptional 4.8% |
Demographics Similar to Bahamians by Unemployment Among Seniors over 65 years
In terms of unemployment among seniors over 65 years, the demographic groups most similar to Bahamians are Nigerian (5.3%, a difference of 0.030%), Peruvian (5.3%, a difference of 0.13%), Ottawa (5.3%, a difference of 0.13%), Colombian (5.3%, a difference of 0.16%), and Immigrants from Caribbean (5.3%, a difference of 0.20%).
| Demographics | Rating | Rank | Unemployment Among Seniors over 65 years |
| Immigrants | Albania | 2.7 /100 | #235 | Tragic 5.3% |
| Immigrants | Costa Rica | 2.1 /100 | #236 | Tragic 5.3% |
| Immigrants | Greece | 2.0 /100 | #237 | Tragic 5.3% |
| Immigrants | Israel | 2.0 /100 | #238 | Tragic 5.3% |
| Immigrants | Senegal | 1.8 /100 | #239 | Tragic 5.3% |
| Immigrants | Trinidad and Tobago | 1.6 /100 | #240 | Tragic 5.3% |
| Apache | 1.3 /100 | #241 | Tragic 5.3% |
| Bahamians | 0.9 /100 | #242 | Tragic 5.3% |
| Nigerians | 0.9 /100 | #243 | Tragic 5.3% |
| Peruvians | 0.8 /100 | #244 | Tragic 5.3% |
| Ottawa | 0.8 /100 | #245 | Tragic 5.3% |
| Colombians | 0.7 /100 | #246 | Tragic 5.3% |
| Immigrants | Caribbean | 0.7 /100 | #247 | Tragic 5.3% |
| French Canadians | 0.7 /100 | #248 | Tragic 5.4% |
| Immigrants | Immigrants | 0.6 /100 | #249 | Tragic 5.4% |