Welsh vs Immigrants from Bolivia Female Unemployment

COMPARE

Welsh
Race
Ancestry
AfghanAfricanAlaska NativeAlaskan AthabascanAlbanianAleutAlsatianAmericanApacheArabArapahoArgentineanArmenianAssyrian/Chaldean/SyriacAustralianAustrianBahamianBangladeshiBarbadianBasqueBelgianBelizeanBermudanBhutaneseBlackfeetBolivianBrazilianBritishBritish West IndianBulgarianBurmeseCajunCambodianCanadianCape VerdeanCarpatho RusynCelticCentral AmericanCentral American IndianCherokeeCheyenneChickasawChileanChineseChippewaChoctawColombianColvilleComancheCosta RicanCreeCreekCroatianCrowCubanCypriotCzechCzechoslovakianDanishDelawareDominicanDutchDutch West IndianEastern EuropeanEcuadorianEgyptianEnglishEstonianEthiopianEuropeanFijianFilipinoFinnishFrenchFrench American IndianFrench CanadianGermanGerman RussianGhanaianGreekGuamanian/ChamorroGuatemalanGuyaneseHaitianHmongHonduranHopiHoumaHungarianIcelanderIndian (Asian)IndonesianInupiatIranianIraqiIrishIroquoisIsraeliItalianJamaicanJapaneseJordanianKenyanKiowaKoreanLaotianLatvianLebaneseLiberianLithuanianLumbeeLuxembourgerMacedonianMalaysianMalteseMarshalleseMenomineeMexicanMexican American IndianMongolianMoroccanNative HawaiianNavajoNepaleseNew ZealanderNicaraguanNigerianNorthern EuropeanNorwegianOkinawanOsageOttawaPaiutePakistaniPalestinianPanamanianParaguayanPennsylvania GermanPeruvianPimaPolishPortuguesePotawatomiPuebloPuerto RicanPuget Sound SalishRomanianRussianSalvadoranSamoanScandinavianScotch-IrishScottishSeminoleSenegaleseSerbianShoshoneSierra LeoneanSiouxSlavicSlovakSloveneSomaliSouth AfricanSouth AmericanSouth American IndianSoviet UnionSpaniardSpanishSpanish AmericanSpanish American IndianSri LankanSubsaharan AfricanSudaneseSwedishSwissSyrianTaiwaneseThaiTlingit-HaidaTohono O'OdhamTonganTrinidadian and TobagonianTsimshianTurkishU.S. Virgin IslanderUgandanUkrainianUruguayanUteVenezuelanVietnameseWelshWest IndianYakamaYaquiYugoslavianYumanYup'ikZimbabwean
Immigration
NonimmigrantsImmigrantsAfghanistanAfricaAlbaniaArgentinaArmeniaAsiaAustraliaAustriaBahamasBangladeshBarbadosBelarusBelgiumBelizeBosnia and HerzegovinaBrazilBulgariaBurma/MyanmarCabo VerdeCambodiaCameroonCanadaCaribbeanCentral AmericaChileChinaColombiaCongoCosta RicaCroatiaCubaCzechoslovakiaDenmarkDominicaDominican RepublicEastern AfricaEastern AsiaEastern EuropeEcuadorEgyptEl SalvadorEnglandEritreaEthiopiaEuropeFijiFranceGermanyGhanaGreeceGrenadaGuatemalaGuyanaHaitiHondurasHong KongHungaryIndiaIndonesiaIranIraqIrelandIsraelItalyJamaicaJapanJordanKazakhstanKenyaKoreaKuwaitLaosLatin AmericaLatviaLebanonLiberiaLithuaniaMalaysiaMexicoMicronesiaMiddle AfricaMoldovaMoroccoNepalNetherlandsNicaraguaNigeriaNorth AmericaNorth MacedoniaNorthern AfricaNorthern EuropeNorwayOceaniaPakistanPanamaPeruPhilippinesPolandPortugalRomaniaRussiaSaudi ArabiaScotlandSenegalSerbiaSierra LeoneSingaporeSomaliaSouth AfricaSouth AmericaSouth Central AsiaSouth Eastern AsiaSouthern EuropeSpainSri LankaSt. Vincent and the GrenadinesSudanSwedenSwitzerlandSyriaTaiwanThailandTrinidad and TobagoTurkeyUgandaUkraineUruguayUzbekistanVenezuelaVietnamWest IndiesWestern AfricaWestern AsiaWestern EuropeYemenZaireZimbabweAzores
Immigrants from Bolivia
Race
Ancestry
AfghanAfricanAlaska NativeAlaskan AthabascanAlbanianAleutAlsatianAmericanApacheArabArapahoArgentineanArmenianAssyrian/Chaldean/SyriacAustralianAustrianBahamianBangladeshiBarbadianBasqueBelgianBelizeanBermudanBhutaneseBlackfeetBolivianBrazilianBritishBritish West IndianBulgarianBurmeseCajunCambodianCanadianCape VerdeanCarpatho RusynCelticCentral AmericanCentral American IndianCherokeeCheyenneChickasawChileanChineseChippewaChoctawColombianColvilleComancheCosta RicanCreeCreekCroatianCrowCubanCypriotCzechCzechoslovakianDanishDelawareDominicanDutchDutch West IndianEastern EuropeanEcuadorianEgyptianEnglishEstonianEthiopianEuropeanFijianFilipinoFinnishFrenchFrench American IndianFrench CanadianGermanGerman RussianGhanaianGreekGuamanian/ChamorroGuatemalanGuyaneseHaitianHmongHonduranHopiHoumaHungarianIcelanderIndian (Asian)IndonesianInupiatIranianIraqiIrishIroquoisIsraeliItalianJamaicanJapaneseJordanianKenyanKiowaKoreanLaotianLatvianLebaneseLiberianLithuanianLumbeeLuxembourgerMacedonianMalaysianMalteseMarshalleseMenomineeMexicanMexican American IndianMongolianMoroccanNative HawaiianNavajoNepaleseNew ZealanderNicaraguanNigerianNorthern EuropeanNorwegianOkinawanOsageOttawaPaiutePakistaniPalestinianPanamanianParaguayanPennsylvania GermanPeruvianPimaPolishPortuguesePotawatomiPuebloPuerto RicanPuget Sound SalishRomanianRussianSalvadoranSamoanScandinavianScotch-IrishScottishSeminoleSenegaleseSerbianShoshoneSierra LeoneanSiouxSlavicSlovakSloveneSomaliSouth AfricanSouth AmericanSouth American IndianSoviet UnionSpaniardSpanishSpanish AmericanSpanish American IndianSri LankanSubsaharan AfricanSudaneseSwedishSwissSyrianTaiwaneseThaiTlingit-HaidaTohono O'OdhamTonganTrinidadian and TobagonianTsimshianTurkishU.S. Virgin IslanderUgandanUkrainianUruguayanUteVenezuelanVietnameseWest IndianYakamaYaquiYugoslavianYumanYup'ikZimbabwean
Immigration
NonimmigrantsImmigrantsAfghanistanAfricaAlbaniaArgentinaArmeniaAsiaAustraliaAustriaBahamasBangladeshBarbadosBelarusBelgiumBelizeBoliviaBosnia and HerzegovinaBrazilBulgariaBurma/MyanmarCabo VerdeCambodiaCameroonCanadaCaribbeanCentral AmericaChileChinaColombiaCongoCosta RicaCroatiaCubaCzechoslovakiaDenmarkDominicaDominican RepublicEastern AfricaEastern AsiaEastern EuropeEcuadorEgyptEl SalvadorEnglandEritreaEthiopiaEuropeFijiFranceGermanyGhanaGreeceGrenadaGuatemalaGuyanaHaitiHondurasHong KongHungaryIndiaIndonesiaIranIraqIrelandIsraelItalyJamaicaJapanJordanKazakhstanKenyaKoreaKuwaitLaosLatin AmericaLatviaLebanonLiberiaLithuaniaMalaysiaMexicoMicronesiaMiddle AfricaMoldovaMoroccoNepalNetherlandsNicaraguaNigeriaNorth AmericaNorth MacedoniaNorthern AfricaNorthern EuropeNorwayOceaniaPakistanPanamaPeruPhilippinesPolandPortugalRomaniaRussiaSaudi ArabiaScotlandSenegalSerbiaSierra LeoneSingaporeSomaliaSouth AfricaSouth AmericaSouth Central AsiaSouth Eastern AsiaSouthern EuropeSpainSri LankaSt. Vincent and the GrenadinesSudanSwedenSwitzerlandSyriaTaiwanThailandTrinidad and TobagoTurkeyUgandaUkraineUruguayUzbekistanVenezuelaVietnamWest IndiesWestern AfricaWestern AsiaWestern EuropeYemenZaireZimbabweAzores
Female Unemployment
Income
Poverty
Unemployment
Labor Participation
Family Structure
Vehicle Availability
Education Level
Disability

Female Unemployment Comparison

Welsh

Immigrants from Bolivia

Exceptional
Exceptional
4.7%
FEMALE UNEMPLOYMENT
99.9/ 100
METRIC RATING
24th/ 347
METRIC RANK
5.0%
FEMALE UNEMPLOYMENT
98.0/ 100
METRIC RATING
74th/ 347
METRIC RANK

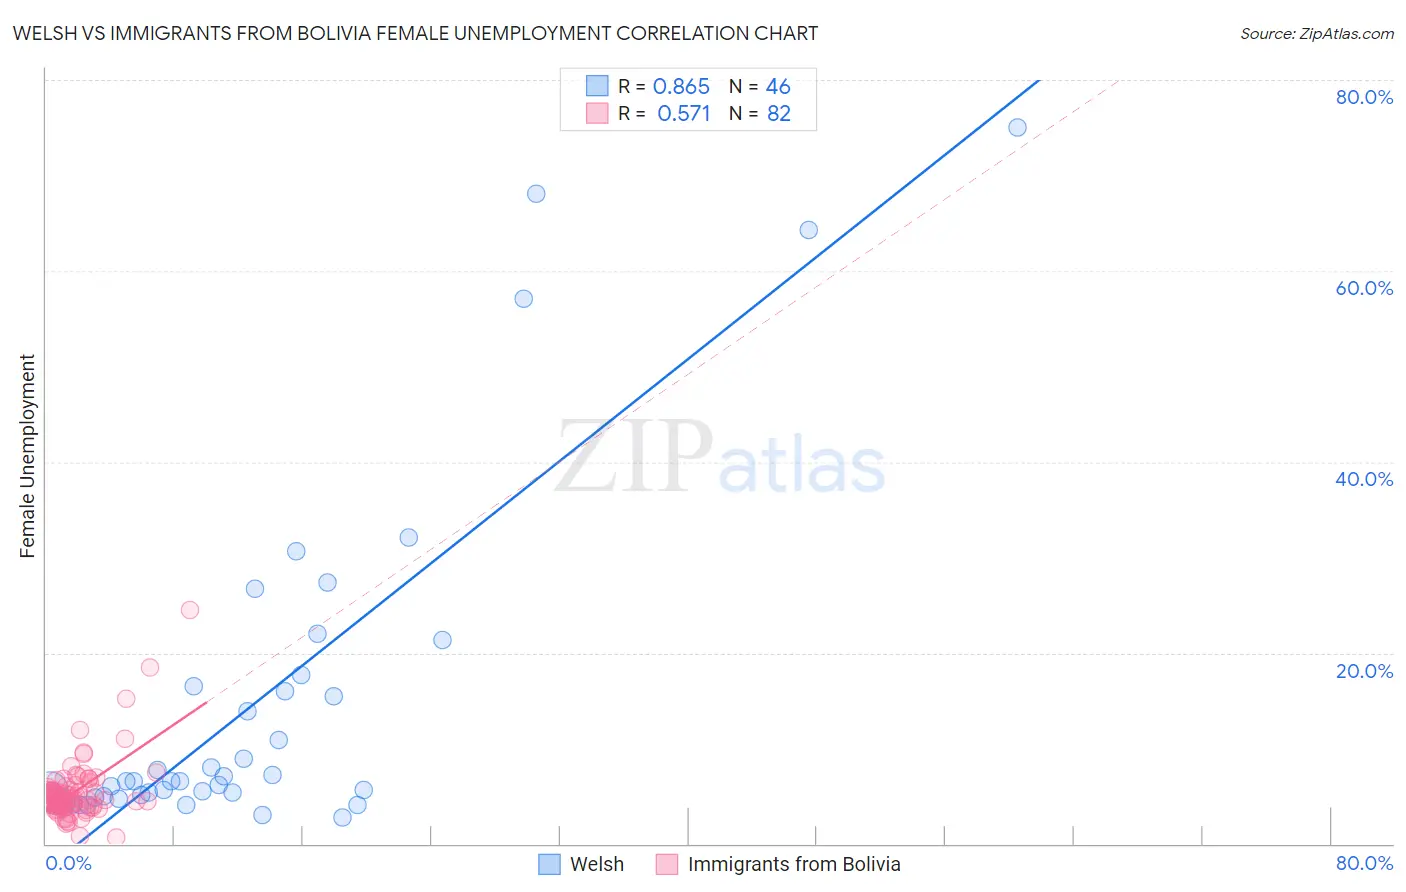
Welsh vs Immigrants from Bolivia Female Unemployment Correlation Chart

The statistical analysis conducted on geographies consisting of 519,058,145 people shows a very strong positive correlation between the proportion of Welsh and unemploymnet rate among females in the United States with a correlation coefficient (R) of 0.865 and weighted average of 4.7%. Similarly, the statistical analysis conducted on geographies consisting of 158,575,090 people shows a substantial positive correlation between the proportion of Immigrants from Bolivia and unemploymnet rate among females in the United States with a correlation coefficient (R) of 0.571 and weighted average of 5.0%, a difference of 4.8%.
Welsh vs Immigrants from Bolivia Female Unemployment

Female Unemployment Correlation Summary

MeasurementWelshImmigrants from Bolivia
Minimum2.8%0.67%
Maximum75.0%24.5%
Range72.2%23.8%
Mean14.8%5.5%
Median6.5%4.8%
Interquartile 25% (IQ1)5.0%3.9%
Interquartile 75% (IQ3)16.5%5.7%
Interquartile Range (IQR)11.5%1.8%
Standard Deviation (Sample)17.8%3.4%
Standard Deviation (Population)17.7%3.4%

Similar Demographics by Female Unemployment

Demographics Similar to Welsh by Female Unemployment

In terms of female unemployment, the demographic groups most similar to Welsh are Immigrants from India (4.7%, a difference of 0.090%), Immigrants from Bosnia and Herzegovina (4.7%, a difference of 0.13%), Scottish (4.7%, a difference of 0.21%), British (4.7%, a difference of 0.29%), and Irish (4.7%, a difference of 0.32%).
DemographicsRating | RankFemale Unemployment
Croatians
99.9
/100
|
#17
Exceptional
4.7%
Latvians
99.9
/100
|
#18
Exceptional
4.7%
Poles
99.9
/100
|
#19
Exceptional
4.7%
Bulgarians
99.9
/100
|
#20
Exceptional
4.7%
Fijians
99.9
/100
|
#21
Exceptional
4.7%
Europeans
99.9
/100
|
#22
Exceptional
4.7%
Scottish
99.9
/100
|
#23
Exceptional
4.7%
Welsh
99.9
/100
|
#24
Exceptional
4.7%
Immigrants | India
99.9
/100
|
#25
Exceptional
4.7%
Immigrants | Bosnia and Herzegovina
99.9
/100
|
#26
Exceptional
4.7%
British
99.9
/100
|
#27
Exceptional
4.7%
Irish
99.9
/100
|
#28
Exceptional
4.7%
Cypriots
99.9
/100
|
#29
Exceptional
4.7%
Lithuanians
99.8
/100
|
#30
Exceptional
4.7%
Sudanese
99.8
/100
|
#31
Exceptional
4.8%

Demographics Similar to Immigrants from Bolivia by Female Unemployment

In terms of female unemployment, the demographic groups most similar to Immigrants from Bolivia are Russian (5.0%, a difference of 0.010%), Immigrants from Singapore (5.0%, a difference of 0.020%), Immigrants from Venezuela (5.0%, a difference of 0.030%), Immigrants from Northern Europe (4.9%, a difference of 0.040%), and German Russian (4.9%, a difference of 0.11%).
DemographicsRating | RankFemale Unemployment
Cubans
98.3
/100
|
#67
Exceptional
4.9%
Tlingit-Haida
98.3
/100
|
#68
Exceptional
4.9%
Immigrants | Ireland
98.2
/100
|
#69
Exceptional
4.9%
Osage
98.2
/100
|
#70
Exceptional
4.9%
German Russians
98.1
/100
|
#71
Exceptional
4.9%
Immigrants | Northern Europe
98.0
/100
|
#72
Exceptional
4.9%
Russians
98.0
/100
|
#73
Exceptional
5.0%
Immigrants | Bolivia
98.0
/100
|
#74
Exceptional
5.0%
Immigrants | Singapore
98.0
/100
|
#75
Exceptional
5.0%
Immigrants | Venezuela
97.9
/100
|
#76
Exceptional
5.0%
Mongolians
97.8
/100
|
#77
Exceptional
5.0%
Immigrants | Netherlands
97.8
/100
|
#78
Exceptional
5.0%
Turks
97.6
/100
|
#79
Exceptional
5.0%
New Zealanders
97.4
/100
|
#80
Exceptional
5.0%
Filipinos
97.3
/100
|
#81
Exceptional
5.0%