Welsh vs U.S. Virgin Islander Female Unemployment
COMPARE
Welsh
U.S. Virgin Islander
Female Unemployment
Female Unemployment Comparison
Welsh
U.S. Virgin Islanders
4.7%
FEMALE UNEMPLOYMENT
99.9/ 100
METRIC RATING
24th/ 347
METRIC RANK
6.2%
FEMALE UNEMPLOYMENT
0.0/ 100
METRIC RATING
302nd/ 347
METRIC RANK
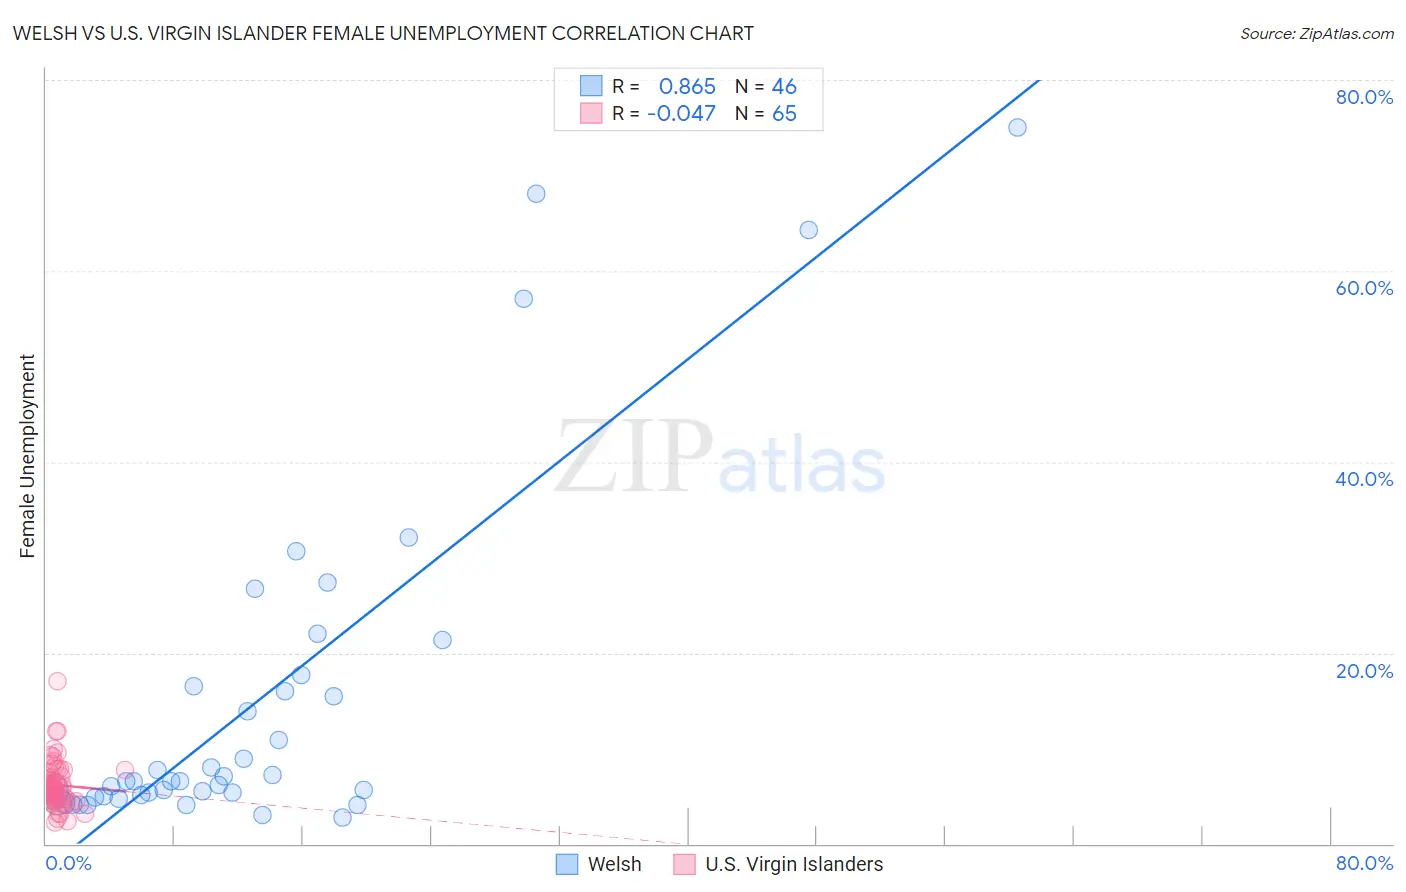
Welsh vs U.S. Virgin Islander Female Unemployment Correlation Chart
The statistical analysis conducted on geographies consisting of 519,058,145 people shows a very strong positive correlation between the proportion of Welsh and unemploymnet rate among females in the United States with a correlation coefficient (R) of 0.865 and weighted average of 4.7%. Similarly, the statistical analysis conducted on geographies consisting of 87,490,240 people shows no correlation between the proportion of U.S. Virgin Islanders and unemploymnet rate among females in the United States with a correlation coefficient (R) of -0.047 and weighted average of 6.2%, a difference of 30.6%.
Female Unemployment Correlation Summary
| Measurement | Welsh | U.S. Virgin Islander |
| Minimum | 2.8% | 2.2% |
| Maximum | 75.0% | 17.0% |
| Range | 72.2% | 14.8% |
| Mean | 14.8% | 6.2% |
| Median | 6.5% | 5.9% |
| Interquartile 25% (IQ1) | 5.0% | 4.8% |
| Interquartile 75% (IQ3) | 16.5% | 7.0% |
| Interquartile Range (IQR) | 11.5% | 2.2% |
| Standard Deviation (Sample) | 17.8% | 2.4% |
| Standard Deviation (Population) | 17.7% | 2.4% |
Similar Demographics by Female Unemployment
Demographics Similar to Welsh by Female Unemployment
In terms of female unemployment, the demographic groups most similar to Welsh are Immigrants from India (4.7%, a difference of 0.090%), Immigrants from Bosnia and Herzegovina (4.7%, a difference of 0.13%), Scottish (4.7%, a difference of 0.21%), British (4.7%, a difference of 0.29%), and Irish (4.7%, a difference of 0.32%).
| Demographics | Rating | Rank | Female Unemployment |
| Croatians | 99.9 /100 | #17 | Exceptional 4.7% |
| Latvians | 99.9 /100 | #18 | Exceptional 4.7% |
| Poles | 99.9 /100 | #19 | Exceptional 4.7% |
| Bulgarians | 99.9 /100 | #20 | Exceptional 4.7% |
| Fijians | 99.9 /100 | #21 | Exceptional 4.7% |
| Europeans | 99.9 /100 | #22 | Exceptional 4.7% |
| Scottish | 99.9 /100 | #23 | Exceptional 4.7% |
| Welsh | 99.9 /100 | #24 | Exceptional 4.7% |
| Immigrants | India | 99.9 /100 | #25 | Exceptional 4.7% |
| Immigrants | Bosnia and Herzegovina | 99.9 /100 | #26 | Exceptional 4.7% |
| British | 99.9 /100 | #27 | Exceptional 4.7% |
| Irish | 99.9 /100 | #28 | Exceptional 4.7% |
| Cypriots | 99.9 /100 | #29 | Exceptional 4.7% |
| Lithuanians | 99.8 /100 | #30 | Exceptional 4.7% |
| Sudanese | 99.8 /100 | #31 | Exceptional 4.8% |
Demographics Similar to U.S. Virgin Islanders by Female Unemployment
In terms of female unemployment, the demographic groups most similar to U.S. Virgin Islanders are Immigrants from Barbados (6.2%, a difference of 0.15%), Barbadian (6.2%, a difference of 0.34%), Immigrants from Haiti (6.1%, a difference of 0.60%), Ute (6.1%, a difference of 0.65%), and Immigrants from Jamaica (6.2%, a difference of 0.71%).
| Demographics | Rating | Rank | Female Unemployment |
| Immigrants | Latin America | 0.0 /100 | #295 | Tragic 6.1% |
| Alaskan Athabascans | 0.0 /100 | #296 | Tragic 6.1% |
| West Indians | 0.0 /100 | #297 | Tragic 6.1% |
| Jamaicans | 0.0 /100 | #298 | Tragic 6.1% |
| Ute | 0.0 /100 | #299 | Tragic 6.1% |
| Immigrants | Haiti | 0.0 /100 | #300 | Tragic 6.1% |
| Immigrants | Barbados | 0.0 /100 | #301 | Tragic 6.2% |
| U.S. Virgin Islanders | 0.0 /100 | #302 | Tragic 6.2% |
| Barbadians | 0.0 /100 | #303 | Tragic 6.2% |
| Immigrants | Jamaica | 0.0 /100 | #304 | Tragic 6.2% |
| Spanish American Indians | 0.0 /100 | #305 | Tragic 6.2% |
| Immigrants | Central America | 0.0 /100 | #306 | Tragic 6.2% |
| Shoshone | 0.0 /100 | #307 | Tragic 6.2% |
| Hispanics or Latinos | 0.0 /100 | #308 | Tragic 6.2% |
| Ecuadorians | 0.0 /100 | #309 | Tragic 6.3% |