Ukrainian vs Comanche Male Unemployment
COMPARE
Ukrainian
Comanche
Male Unemployment
Male Unemployment Comparison
Ukrainians
Comanche
5.1%
MALE UNEMPLOYMENT
88.4/ 100
METRIC RATING
120th/ 347
METRIC RANK
5.8%
MALE UNEMPLOYMENT
0.2/ 100
METRIC RATING
256th/ 347
METRIC RANK
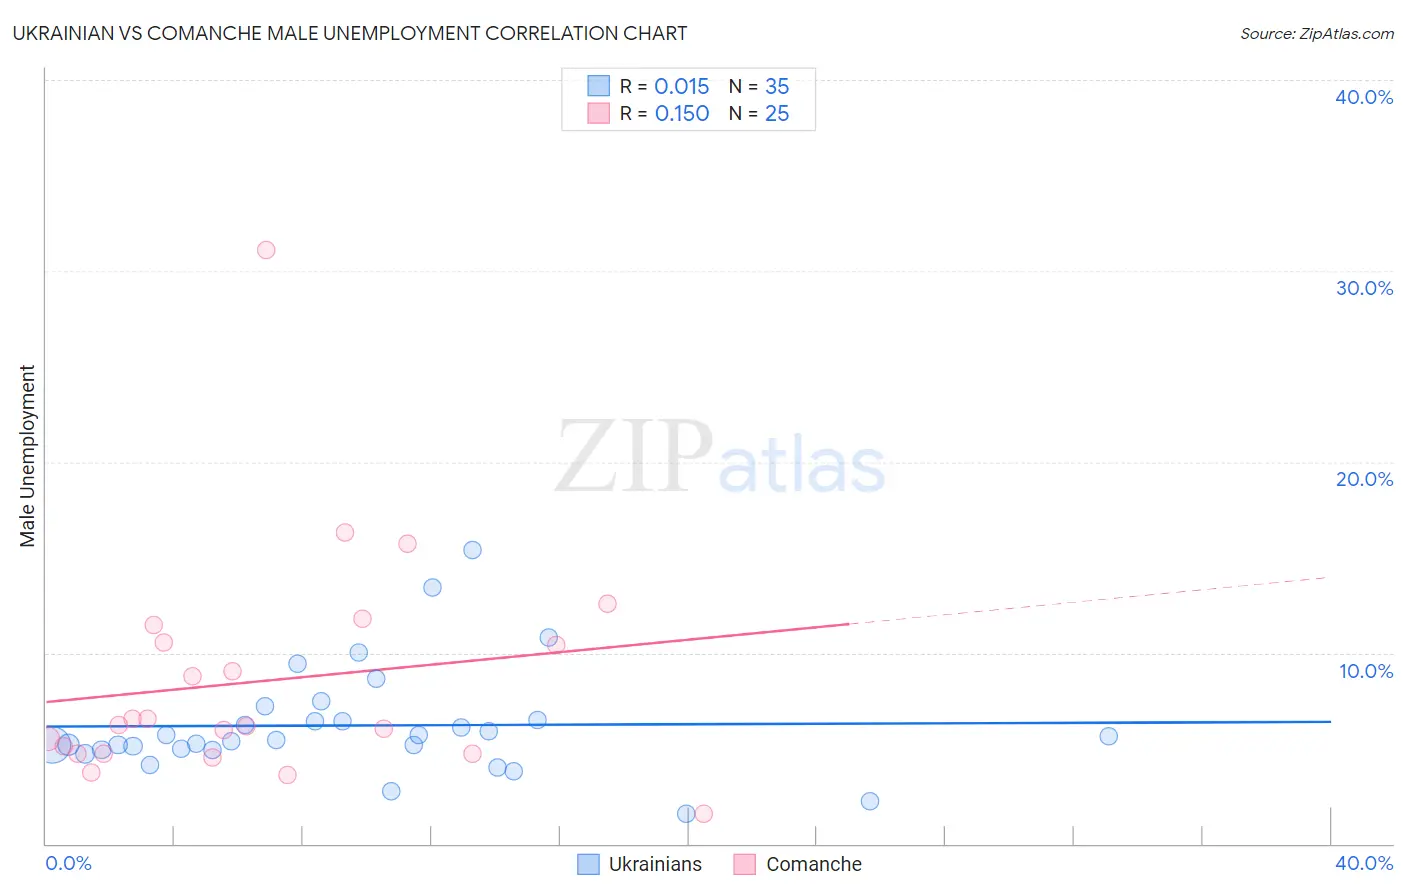
Ukrainian vs Comanche Male Unemployment Correlation Chart
The statistical analysis conducted on geographies consisting of 445,622,080 people shows no correlation between the proportion of Ukrainians and unemployment rate among males in the United States with a correlation coefficient (R) of 0.015 and weighted average of 5.1%. Similarly, the statistical analysis conducted on geographies consisting of 109,543,085 people shows a poor positive correlation between the proportion of Comanche and unemployment rate among males in the United States with a correlation coefficient (R) of 0.150 and weighted average of 5.8%, a difference of 12.8%.
Male Unemployment Correlation Summary
| Measurement | Ukrainian | Comanche |
| Minimum | 1.6% | 1.6% |
| Maximum | 15.4% | 31.1% |
| Range | 13.8% | 29.5% |
| Mean | 6.2% | 8.5% |
| Median | 5.4% | 6.2% |
| Interquartile 25% (IQ1) | 4.9% | 4.7% |
| Interquartile 75% (IQ3) | 6.5% | 11.0% |
| Interquartile Range (IQR) | 1.6% | 6.3% |
| Standard Deviation (Sample) | 2.8% | 6.0% |
| Standard Deviation (Population) | 2.8% | 5.9% |
Similar Demographics by Male Unemployment
Demographics Similar to Ukrainians by Male Unemployment
In terms of male unemployment, the demographic groups most similar to Ukrainians are Mongolian (5.1%, a difference of 0.010%), French Canadian (5.1%, a difference of 0.020%), Nicaraguan (5.1%, a difference of 0.040%), Cypriot (5.1%, a difference of 0.060%), and Estonian (5.1%, a difference of 0.090%).
| Demographics | Rating | Rank | Male Unemployment |
| Immigrants | Austria | 90.3 /100 | #113 | Exceptional 5.1% |
| Romanians | 89.8 /100 | #114 | Excellent 5.1% |
| Immigrants | Asia | 89.6 /100 | #115 | Excellent 5.1% |
| Immigrants | Denmark | 89.4 /100 | #116 | Excellent 5.1% |
| Estonians | 89.0 /100 | #117 | Excellent 5.1% |
| Cypriots | 88.8 /100 | #118 | Excellent 5.1% |
| French Canadians | 88.6 /100 | #119 | Excellent 5.1% |
| Ukrainians | 88.4 /100 | #120 | Excellent 5.1% |
| Mongolians | 88.4 /100 | #121 | Excellent 5.1% |
| Nicaraguans | 88.2 /100 | #122 | Excellent 5.1% |
| Palestinians | 87.7 /100 | #123 | Excellent 5.1% |
| Immigrants | Latvia | 87.5 /100 | #124 | Excellent 5.1% |
| Immigrants | Lithuania | 87.2 /100 | #125 | Excellent 5.1% |
| Immigrants | Colombia | 86.8 /100 | #126 | Excellent 5.1% |
| Immigrants | Brazil | 86.3 /100 | #127 | Excellent 5.2% |
Demographics Similar to Comanche by Male Unemployment
In terms of male unemployment, the demographic groups most similar to Comanche are Kiowa (5.8%, a difference of 0.080%), Hispanic or Latino (5.8%, a difference of 0.17%), Japanese (5.8%, a difference of 0.18%), Dutch West Indian (5.8%, a difference of 0.30%), and Mexican American Indian (5.8%, a difference of 0.35%).
| Demographics | Rating | Rank | Male Unemployment |
| Cree | 0.4 /100 | #249 | Tragic 5.7% |
| Immigrants | Bahamas | 0.4 /100 | #250 | Tragic 5.7% |
| Spanish Americans | 0.3 /100 | #251 | Tragic 5.7% |
| Mexicans | 0.2 /100 | #252 | Tragic 5.8% |
| Mexican American Indians | 0.2 /100 | #253 | Tragic 5.8% |
| Japanese | 0.2 /100 | #254 | Tragic 5.8% |
| Kiowa | 0.2 /100 | #255 | Tragic 5.8% |
| Comanche | 0.2 /100 | #256 | Tragic 5.8% |
| Hispanics or Latinos | 0.1 /100 | #257 | Tragic 5.8% |
| Dutch West Indians | 0.1 /100 | #258 | Tragic 5.8% |
| Cajuns | 0.1 /100 | #259 | Tragic 5.8% |
| Immigrants | Central America | 0.1 /100 | #260 | Tragic 5.8% |
| Liberians | 0.1 /100 | #261 | Tragic 5.8% |
| Immigrants | Portugal | 0.1 /100 | #262 | Tragic 5.9% |
| Immigrants | Latin America | 0.1 /100 | #263 | Tragic 5.9% |