Ukrainian vs Comanche Child Poverty Among Boys Under 16
COMPARE
Ukrainian
Comanche
Child Poverty Among Boys Under 16
Child Poverty Among Boys Under 16 Comparison
Ukrainians
Comanche
14.7%
CHILD POVERTY AMONG BOYS UNDER 16
97.6/ 100
METRIC RATING
82nd/ 347
METRIC RANK
20.1%
CHILD POVERTY AMONG BOYS UNDER 16
0.0/ 100
METRIC RATING
282nd/ 347
METRIC RANK
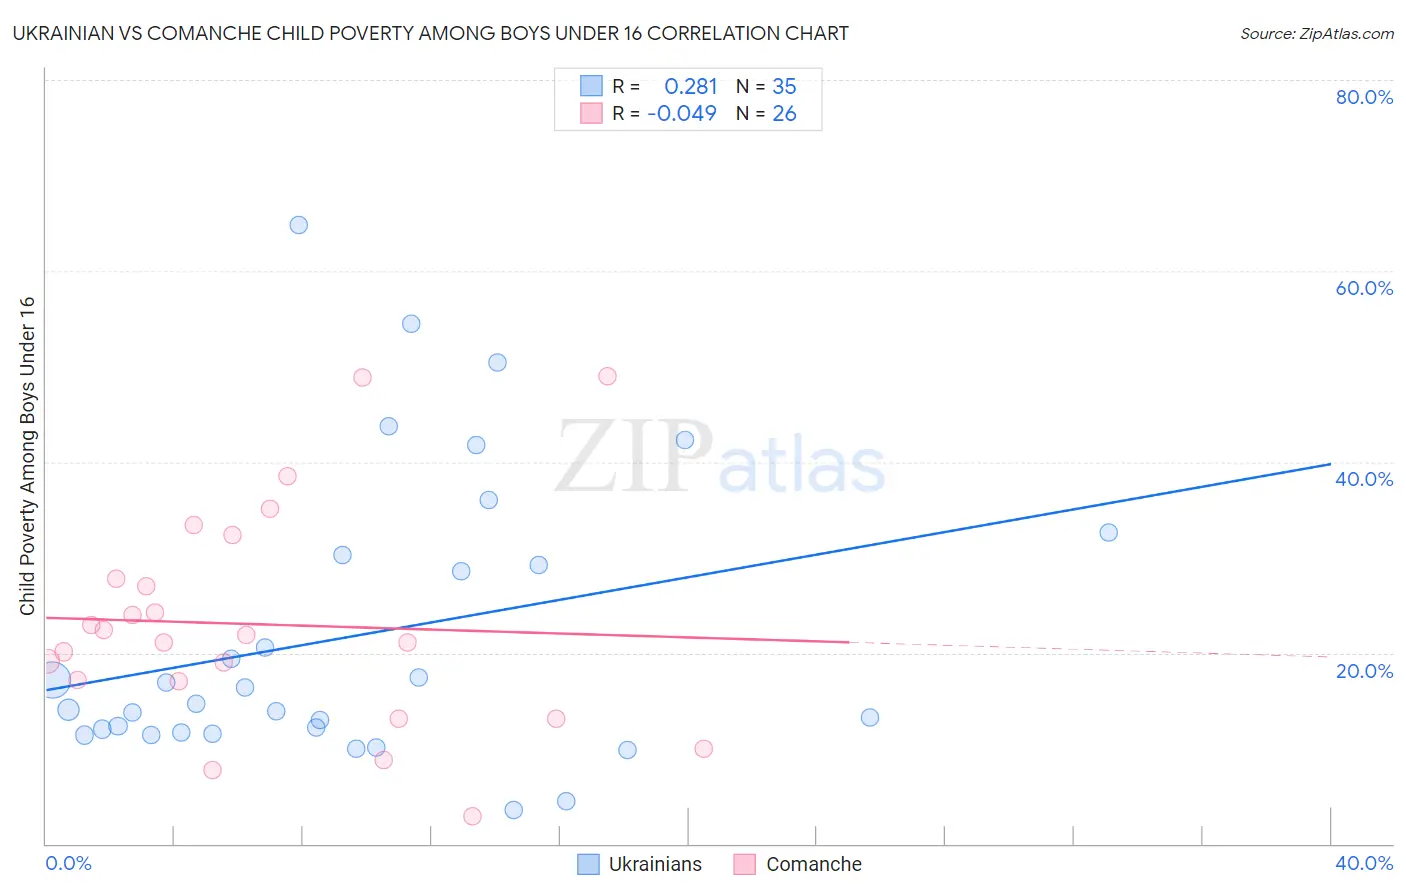
Ukrainian vs Comanche Child Poverty Among Boys Under 16 Correlation Chart
The statistical analysis conducted on geographies consisting of 436,859,544 people shows a weak positive correlation between the proportion of Ukrainians and poverty level among boys under the age of 16 in the United States with a correlation coefficient (R) of 0.281 and weighted average of 14.7%. Similarly, the statistical analysis conducted on geographies consisting of 109,333,383 people shows no correlation between the proportion of Comanche and poverty level among boys under the age of 16 in the United States with a correlation coefficient (R) of -0.049 and weighted average of 20.1%, a difference of 36.3%.
Child Poverty Among Boys Under 16 Correlation Summary
| Measurement | Ukrainian | Comanche |
| Minimum | 3.5% | 2.8% |
| Maximum | 64.8% | 48.9% |
| Range | 61.3% | 46.1% |
| Mean | 21.8% | 23.0% |
| Median | 14.7% | 21.5% |
| Interquartile 25% (IQ1) | 11.7% | 17.0% |
| Interquartile 75% (IQ3) | 30.2% | 27.8% |
| Interquartile Range (IQR) | 18.5% | 10.9% |
| Standard Deviation (Sample) | 15.1% | 11.5% |
| Standard Deviation (Population) | 14.9% | 11.2% |
Similar Demographics by Child Poverty Among Boys Under 16
Demographics Similar to Ukrainians by Child Poverty Among Boys Under 16
In terms of child poverty among boys under 16, the demographic groups most similar to Ukrainians are Immigrants from Canada (14.7%, a difference of 0.020%), Immigrants from Russia (14.7%, a difference of 0.16%), Immigrants from South Africa (14.8%, a difference of 0.23%), Immigrants from Eastern Europe (14.7%, a difference of 0.24%), and Egyptian (14.7%, a difference of 0.35%).
| Demographics | Rating | Rank | Child Poverty Among Boys Under 16 |
| Immigrants | Poland | 97.9 /100 | #75 | Exceptional 14.7% |
| Immigrants | Croatia | 97.9 /100 | #76 | Exceptional 14.7% |
| Macedonians | 97.9 /100 | #77 | Exceptional 14.7% |
| Egyptians | 97.8 /100 | #78 | Exceptional 14.7% |
| Immigrants | Eastern Europe | 97.8 /100 | #79 | Exceptional 14.7% |
| Immigrants | Russia | 97.7 /100 | #80 | Exceptional 14.7% |
| Immigrants | Canada | 97.6 /100 | #81 | Exceptional 14.7% |
| Ukrainians | 97.6 /100 | #82 | Exceptional 14.7% |
| Immigrants | South Africa | 97.4 /100 | #83 | Exceptional 14.8% |
| Swiss | 97.3 /100 | #84 | Exceptional 14.8% |
| Taiwanese | 97.3 /100 | #85 | Exceptional 14.8% |
| Germans | 97.2 /100 | #86 | Exceptional 14.8% |
| Northern Europeans | 97.2 /100 | #87 | Exceptional 14.8% |
| Immigrants | North America | 97.1 /100 | #88 | Exceptional 14.8% |
| Immigrants | Argentina | 97.1 /100 | #89 | Exceptional 14.8% |
Demographics Similar to Comanche by Child Poverty Among Boys Under 16
In terms of child poverty among boys under 16, the demographic groups most similar to Comanche are Immigrants from Zaire (20.1%, a difference of 0.050%), Central American (20.1%, a difference of 0.11%), Immigrants from Jamaica (20.1%, a difference of 0.13%), Bangladeshi (20.0%, a difference of 0.23%), and Immigrants from West Indies (20.0%, a difference of 0.36%).
| Demographics | Rating | Rank | Child Poverty Among Boys Under 16 |
| Jamaicans | 0.0 /100 | #275 | Tragic 20.0% |
| Sub-Saharan Africans | 0.0 /100 | #276 | Tragic 20.0% |
| Immigrants | Barbados | 0.0 /100 | #277 | Tragic 20.0% |
| Immigrants | West Indies | 0.0 /100 | #278 | Tragic 20.0% |
| Bangladeshis | 0.0 /100 | #279 | Tragic 20.0% |
| Central Americans | 0.0 /100 | #280 | Tragic 20.1% |
| Immigrants | Zaire | 0.0 /100 | #281 | Tragic 20.1% |
| Comanche | 0.0 /100 | #282 | Tragic 20.1% |
| Immigrants | Jamaica | 0.0 /100 | #283 | Tragic 20.1% |
| Barbadians | 0.0 /100 | #284 | Tragic 20.2% |
| Arapaho | 0.0 /100 | #285 | Tragic 20.2% |
| West Indians | 0.0 /100 | #286 | Tragic 20.3% |
| Immigrants | Belize | 0.0 /100 | #287 | Tragic 20.3% |
| Immigrants | St. Vincent and the Grenadines | 0.0 /100 | #288 | Tragic 20.3% |
| Blackfeet | 0.0 /100 | #289 | Tragic 20.4% |