Swiss vs Comanche Male Unemployment
COMPARE
Swiss
Comanche
Male Unemployment
Male Unemployment Comparison
Swiss
Comanche
4.7%
MALE UNEMPLOYMENT
99.9/ 100
METRIC RATING
16th/ 347
METRIC RANK
5.8%
MALE UNEMPLOYMENT
0.2/ 100
METRIC RATING
256th/ 347
METRIC RANK
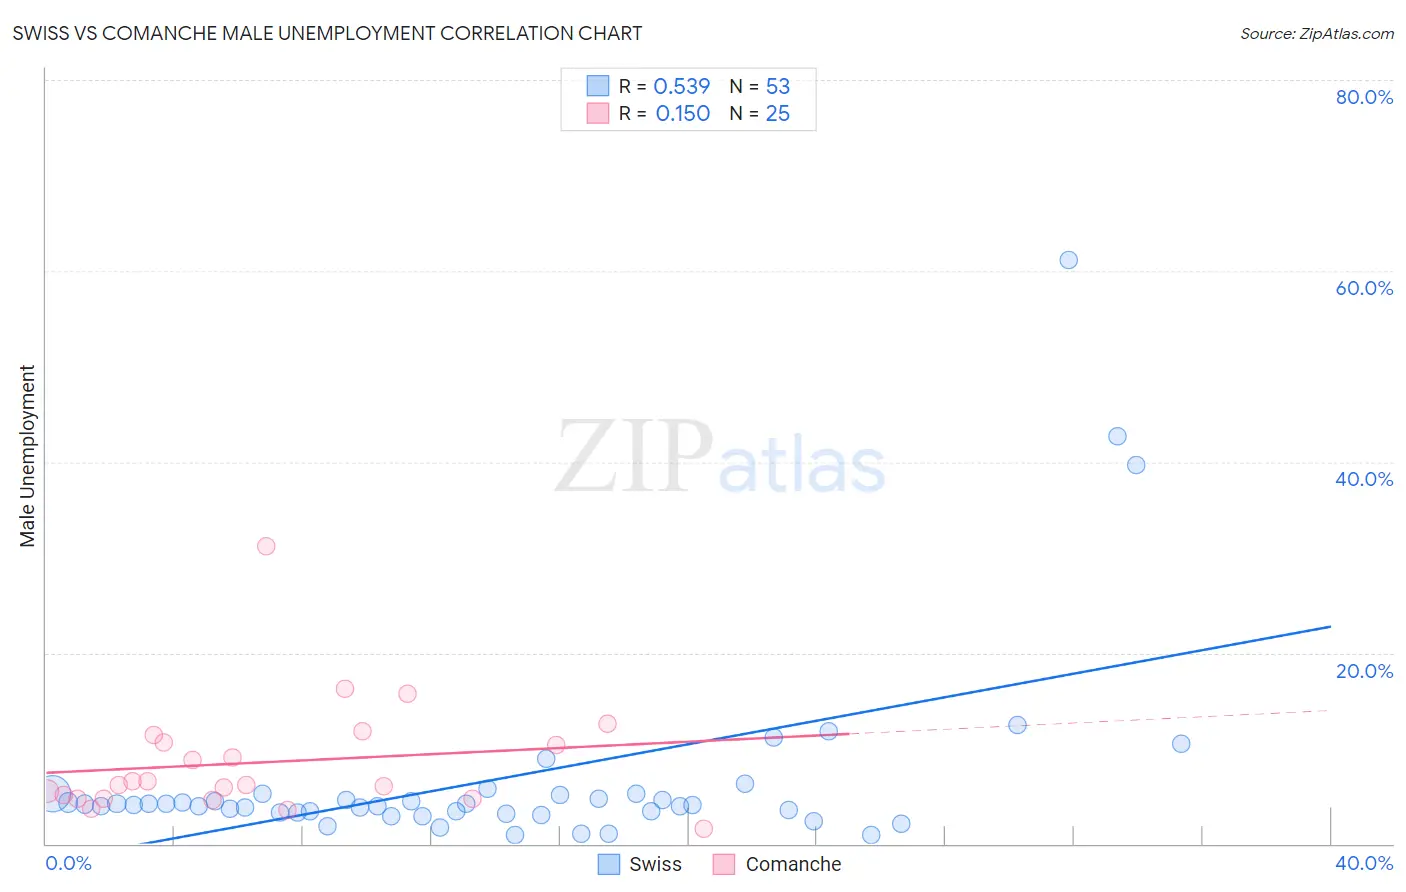
Swiss vs Comanche Male Unemployment Correlation Chart
The statistical analysis conducted on geographies consisting of 460,477,657 people shows a substantial positive correlation between the proportion of Swiss and unemployment rate among males in the United States with a correlation coefficient (R) of 0.539 and weighted average of 4.7%. Similarly, the statistical analysis conducted on geographies consisting of 109,543,085 people shows a poor positive correlation between the proportion of Comanche and unemployment rate among males in the United States with a correlation coefficient (R) of 0.150 and weighted average of 5.8%, a difference of 23.0%.
Male Unemployment Correlation Summary
| Measurement | Swiss | Comanche |
| Minimum | 0.90% | 1.6% |
| Maximum | 61.1% | 31.1% |
| Range | 60.2% | 29.5% |
| Mean | 6.9% | 8.5% |
| Median | 4.1% | 6.2% |
| Interquartile 25% (IQ1) | 3.3% | 4.7% |
| Interquartile 75% (IQ3) | 5.2% | 11.0% |
| Interquartile Range (IQR) | 1.8% | 6.3% |
| Standard Deviation (Sample) | 10.7% | 6.0% |
| Standard Deviation (Population) | 10.6% | 5.9% |
Similar Demographics by Male Unemployment
Demographics Similar to Swiss by Male Unemployment
In terms of male unemployment, the demographic groups most similar to Swiss are Scandinavian (4.7%, a difference of 0.050%), German (4.7%, a difference of 0.32%), Bolivian (4.7%, a difference of 0.34%), Filipino (4.7%, a difference of 0.73%), and Immigrants from Bolivia (4.7%, a difference of 1.0%).
| Demographics | Rating | Rank | Male Unemployment |
| Thais | 100.0 /100 | #9 | Exceptional 4.6% |
| Cubans | 100.0 /100 | #10 | Exceptional 4.6% |
| Swedes | 100.0 /100 | #11 | Exceptional 4.6% |
| Immigrants | Bolivia | 100.0 /100 | #12 | Exceptional 4.7% |
| Bolivians | 100.0 /100 | #13 | Exceptional 4.7% |
| Germans | 100.0 /100 | #14 | Exceptional 4.7% |
| Scandinavians | 100.0 /100 | #15 | Exceptional 4.7% |
| Swiss | 99.9 /100 | #16 | Exceptional 4.7% |
| Filipinos | 99.9 /100 | #17 | Exceptional 4.7% |
| English | 99.9 /100 | #18 | Exceptional 4.8% |
| Europeans | 99.9 /100 | #19 | Exceptional 4.8% |
| Pennsylvania Germans | 99.9 /100 | #20 | Exceptional 4.8% |
| Immigrants | Taiwan | 99.9 /100 | #21 | Exceptional 4.8% |
| Carpatho Rusyns | 99.9 /100 | #22 | Exceptional 4.8% |
| Tongans | 99.9 /100 | #23 | Exceptional 4.8% |
Demographics Similar to Comanche by Male Unemployment
In terms of male unemployment, the demographic groups most similar to Comanche are Kiowa (5.8%, a difference of 0.080%), Hispanic or Latino (5.8%, a difference of 0.17%), Japanese (5.8%, a difference of 0.18%), Dutch West Indian (5.8%, a difference of 0.30%), and Mexican American Indian (5.8%, a difference of 0.35%).
| Demographics | Rating | Rank | Male Unemployment |
| Cree | 0.4 /100 | #249 | Tragic 5.7% |
| Immigrants | Bahamas | 0.4 /100 | #250 | Tragic 5.7% |
| Spanish Americans | 0.3 /100 | #251 | Tragic 5.7% |
| Mexicans | 0.2 /100 | #252 | Tragic 5.8% |
| Mexican American Indians | 0.2 /100 | #253 | Tragic 5.8% |
| Japanese | 0.2 /100 | #254 | Tragic 5.8% |
| Kiowa | 0.2 /100 | #255 | Tragic 5.8% |
| Comanche | 0.2 /100 | #256 | Tragic 5.8% |
| Hispanics or Latinos | 0.1 /100 | #257 | Tragic 5.8% |
| Dutch West Indians | 0.1 /100 | #258 | Tragic 5.8% |
| Cajuns | 0.1 /100 | #259 | Tragic 5.8% |
| Immigrants | Central America | 0.1 /100 | #260 | Tragic 5.8% |
| Liberians | 0.1 /100 | #261 | Tragic 5.8% |
| Immigrants | Portugal | 0.1 /100 | #262 | Tragic 5.9% |
| Immigrants | Latin America | 0.1 /100 | #263 | Tragic 5.9% |