Tlingit-Haida vs Ethiopian Unemployment Among Youth under 25 years
COMPARE
Tlingit-Haida
Ethiopian
Unemployment Among Youth under 25 years
Unemployment Among Youth under 25 years Comparison
Tlingit-Haida
Ethiopians
12.7%
UNEMPLOYMENT AMONG YOUTH UNDER 25 YEARS
0.0/ 100
METRIC RATING
268th/ 347
METRIC RANK
11.4%
UNEMPLOYMENT AMONG YOUTH UNDER 25 YEARS
83.2/ 100
METRIC RATING
132nd/ 347
METRIC RANK
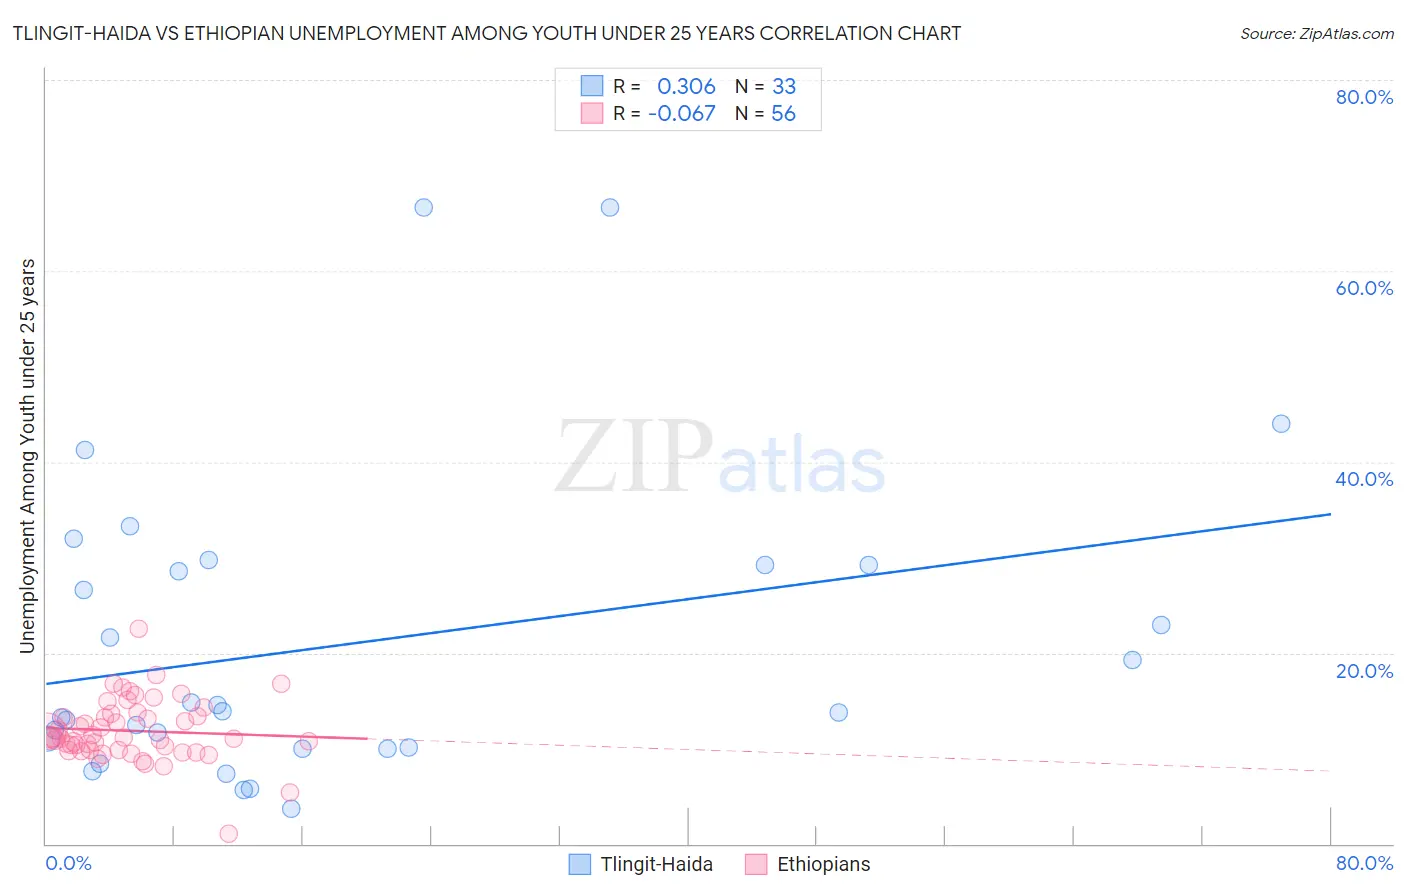
Tlingit-Haida vs Ethiopian Unemployment Among Youth under 25 years Correlation Chart
The statistical analysis conducted on geographies consisting of 60,635,463 people shows a mild positive correlation between the proportion of Tlingit-Haida and unemployment rate among youth under the age of 25 in the United States with a correlation coefficient (R) of 0.306 and weighted average of 12.7%. Similarly, the statistical analysis conducted on geographies consisting of 222,371,214 people shows a slight negative correlation between the proportion of Ethiopians and unemployment rate among youth under the age of 25 in the United States with a correlation coefficient (R) of -0.067 and weighted average of 11.4%, a difference of 10.9%.
Unemployment Among Youth under 25 years Correlation Summary
| Measurement | Tlingit-Haida | Ethiopian |
| Minimum | 3.7% | 1.1% |
| Maximum | 66.6% | 22.5% |
| Range | 62.9% | 21.4% |
| Mean | 20.9% | 11.8% |
| Median | 13.9% | 11.1% |
| Interquartile 25% (IQ1) | 10.1% | 9.8% |
| Interquartile 75% (IQ3) | 29.2% | 13.4% |
| Interquartile Range (IQR) | 19.1% | 3.6% |
| Standard Deviation (Sample) | 15.8% | 3.3% |
| Standard Deviation (Population) | 15.6% | 3.2% |
Similar Demographics by Unemployment Among Youth under 25 years
Demographics Similar to Tlingit-Haida by Unemployment Among Youth under 25 years
In terms of unemployment among youth under 25 years, the demographic groups most similar to Tlingit-Haida are Subsaharan African (12.6%, a difference of 0.080%), Kiowa (12.7%, a difference of 0.12%), Immigrants from Latin America (12.6%, a difference of 0.21%), Nepalese (12.5%, a difference of 1.1%), and Puget Sound Salish (12.5%, a difference of 1.2%).
| Demographics | Rating | Rank | Unemployment Among Youth under 25 years |
| Immigrants | El Salvador | 0.1 /100 | #261 | Tragic 12.4% |
| Immigrants | Mexico | 0.1 /100 | #262 | Tragic 12.4% |
| Cree | 0.1 /100 | #263 | Tragic 12.4% |
| Puget Sound Salish | 0.1 /100 | #264 | Tragic 12.5% |
| Nepalese | 0.0 /100 | #265 | Tragic 12.5% |
| Immigrants | Latin America | 0.0 /100 | #266 | Tragic 12.6% |
| Sub-Saharan Africans | 0.0 /100 | #267 | Tragic 12.6% |
| Tlingit-Haida | 0.0 /100 | #268 | Tragic 12.7% |
| Kiowa | 0.0 /100 | #269 | Tragic 12.7% |
| Immigrants | Liberia | 0.0 /100 | #270 | Tragic 12.8% |
| Immigrants | Bahamas | 0.0 /100 | #271 | Tragic 12.9% |
| Cape Verdeans | 0.0 /100 | #272 | Tragic 12.9% |
| Nigerians | 0.0 /100 | #273 | Tragic 13.0% |
| Immigrants | Nigeria | 0.0 /100 | #274 | Tragic 13.0% |
| Bermudans | 0.0 /100 | #275 | Tragic 13.0% |
Demographics Similar to Ethiopians by Unemployment Among Youth under 25 years
In terms of unemployment among youth under 25 years, the demographic groups most similar to Ethiopians are Lebanese (11.4%, a difference of 0.010%), Immigrants from Spain (11.4%, a difference of 0.11%), Hungarian (11.4%, a difference of 0.20%), Immigrants from Chile (11.4%, a difference of 0.20%), and Turkish (11.4%, a difference of 0.21%).
| Demographics | Rating | Rank | Unemployment Among Youth under 25 years |
| Immigrants | Argentina | 87.2 /100 | #125 | Excellent 11.4% |
| Canadians | 86.6 /100 | #126 | Excellent 11.4% |
| Greeks | 86.2 /100 | #127 | Excellent 11.4% |
| Immigrants | Hungary | 86.0 /100 | #128 | Excellent 11.4% |
| Turks | 85.8 /100 | #129 | Excellent 11.4% |
| Hungarians | 85.7 /100 | #130 | Excellent 11.4% |
| Immigrants | Spain | 84.6 /100 | #131 | Excellent 11.4% |
| Ethiopians | 83.2 /100 | #132 | Excellent 11.4% |
| Lebanese | 83.1 /100 | #133 | Excellent 11.4% |
| Immigrants | Chile | 80.4 /100 | #134 | Excellent 11.4% |
| Immigrants | Oceania | 80.2 /100 | #135 | Excellent 11.4% |
| Romanians | 80.1 /100 | #136 | Excellent 11.4% |
| Asians | 79.7 /100 | #137 | Good 11.4% |
| Immigrants | England | 78.1 /100 | #138 | Good 11.5% |
| Immigrants | Indonesia | 77.6 /100 | #139 | Good 11.5% |