Scottish vs Immigrants from Trinidad and Tobago Unemployment Among Women with Children Ages 6 to 17 years
COMPARE
Scottish
Immigrants from Trinidad and Tobago
Unemployment Among Women with Children Ages 6 to 17 years
Unemployment Among Women with Children Ages 6 to 17 years Comparison
Scottish
Immigrants from Trinidad and Tobago
9.4%
UNEMPLOYMENT AMONG WOMEN WITH CHILDREN AGES 6 TO 17 YEARS
2.0/ 100
METRIC RATING
243rd/ 347
METRIC RANK
9.1%
UNEMPLOYMENT AMONG WOMEN WITH CHILDREN AGES 6 TO 17 YEARS
16.7/ 100
METRIC RATING
201st/ 347
METRIC RANK
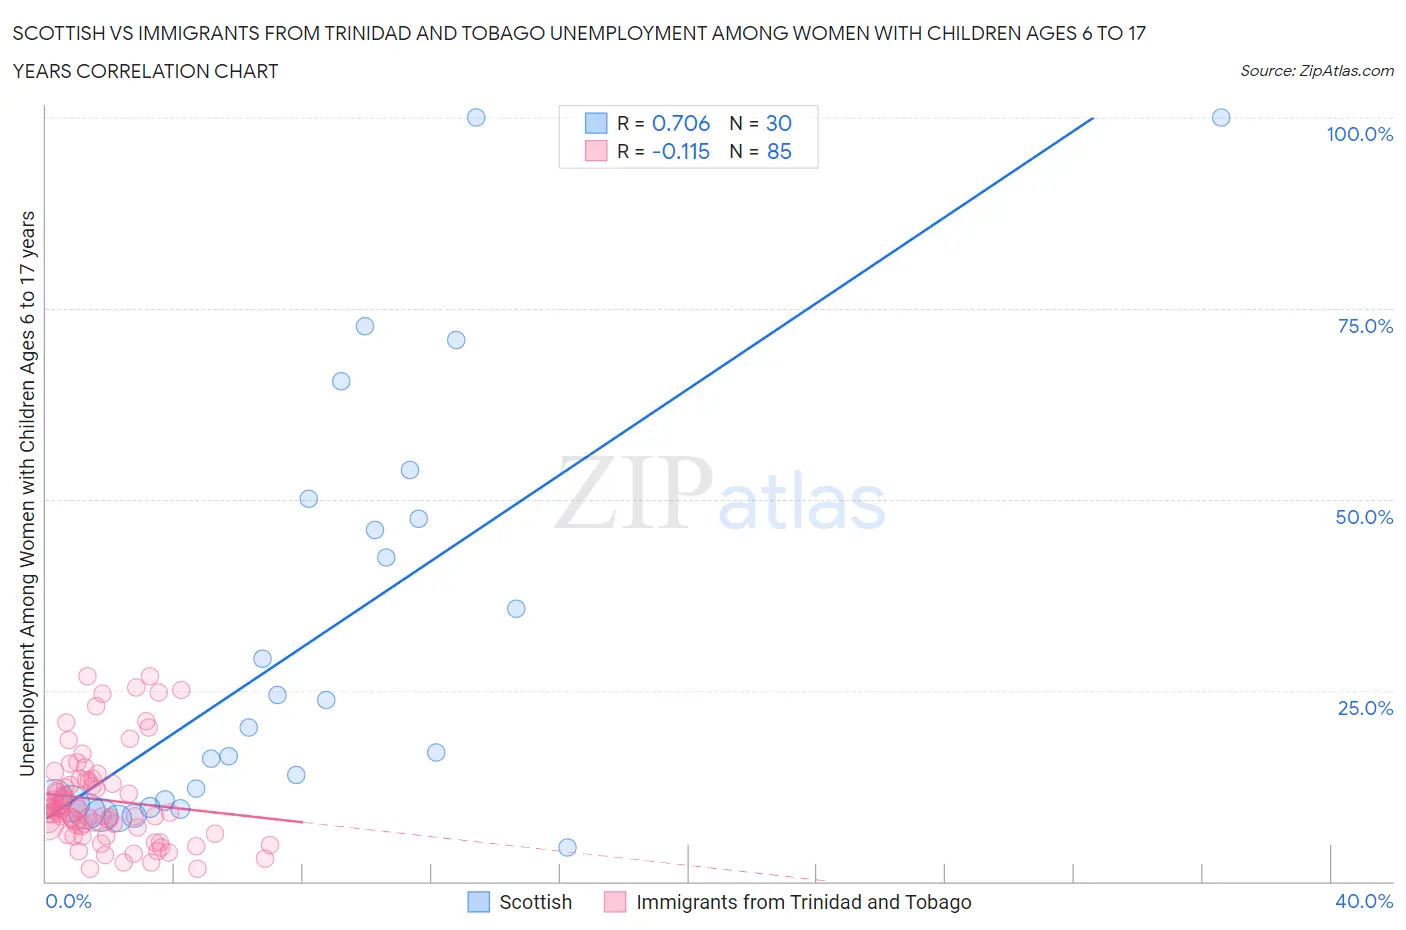
Scottish vs Immigrants from Trinidad and Tobago Unemployment Among Women with Children Ages 6 to 17 years Correlation Chart
The statistical analysis conducted on geographies consisting of 354,178,557 people shows a strong positive correlation between the proportion of Scottish and unemployment rate among women with children between the ages 6 and 17 in the United States with a correlation coefficient (R) of 0.706 and weighted average of 9.4%. Similarly, the statistical analysis conducted on geographies consisting of 179,476,892 people shows a poor negative correlation between the proportion of Immigrants from Trinidad and Tobago and unemployment rate among women with children between the ages 6 and 17 in the United States with a correlation coefficient (R) of -0.115 and weighted average of 9.1%, a difference of 2.5%.
Unemployment Among Women with Children Ages 6 to 17 years Correlation Summary
| Measurement | Scottish | Immigrants from Trinidad and Tobago |
| Minimum | 4.5% | 1.6% |
| Maximum | 100.0% | 26.8% |
| Range | 95.5% | 25.2% |
| Mean | 31.6% | 10.7% |
| Median | 18.5% | 9.1% |
| Interquartile 25% (IQ1) | 10.1% | 6.7% |
| Interquartile 75% (IQ3) | 47.4% | 13.2% |
| Interquartile Range (IQR) | 37.3% | 6.5% |
| Standard Deviation (Sample) | 27.5% | 6.1% |
| Standard Deviation (Population) | 27.0% | 6.1% |
Similar Demographics by Unemployment Among Women with Children Ages 6 to 17 years
Demographics Similar to Scottish by Unemployment Among Women with Children Ages 6 to 17 years
In terms of unemployment among women with children ages 6 to 17 years, the demographic groups most similar to Scottish are English (9.4%, a difference of 0.050%), Immigrants from Cameroon (9.4%, a difference of 0.080%), Immigrants from Colombia (9.3%, a difference of 0.090%), Colombian (9.3%, a difference of 0.11%), and Guatemalan (9.3%, a difference of 0.18%).
| Demographics | Rating | Rank | Unemployment Among Women with Children Ages 6 to 17 years |
| Hungarians | 3.0 /100 | #236 | Tragic 9.3% |
| Immigrants | Belize | 2.8 /100 | #237 | Tragic 9.3% |
| Arabs | 2.7 /100 | #238 | Tragic 9.3% |
| Immigrants | Saudi Arabia | 2.7 /100 | #239 | Tragic 9.3% |
| Guatemalans | 2.3 /100 | #240 | Tragic 9.3% |
| Colombians | 2.2 /100 | #241 | Tragic 9.3% |
| Immigrants | Colombia | 2.1 /100 | #242 | Tragic 9.3% |
| Scottish | 2.0 /100 | #243 | Tragic 9.4% |
| English | 1.9 /100 | #244 | Tragic 9.4% |
| Immigrants | Cameroon | 1.8 /100 | #245 | Tragic 9.4% |
| Immigrants | Africa | 1.6 /100 | #246 | Tragic 9.4% |
| Poles | 1.5 /100 | #247 | Tragic 9.4% |
| Dutch | 1.5 /100 | #248 | Tragic 9.4% |
| Immigrants | South America | 1.5 /100 | #249 | Tragic 9.4% |
| Immigrants | Guatemala | 1.3 /100 | #250 | Tragic 9.4% |
Demographics Similar to Immigrants from Trinidad and Tobago by Unemployment Among Women with Children Ages 6 to 17 years
In terms of unemployment among women with children ages 6 to 17 years, the demographic groups most similar to Immigrants from Trinidad and Tobago are Immigrants from Middle Africa (9.1%, a difference of 0.090%), Trinidadian and Tobagonian (9.1%, a difference of 0.11%), Maltese (9.1%, a difference of 0.11%), Immigrants from Canada (9.1%, a difference of 0.12%), and Immigrants from Western Europe (9.1%, a difference of 0.22%).
| Demographics | Rating | Rank | Unemployment Among Women with Children Ages 6 to 17 years |
| Immigrants | Kazakhstan | 25.3 /100 | #194 | Fair 9.1% |
| Austrians | 25.0 /100 | #195 | Fair 9.1% |
| Brazilians | 24.4 /100 | #196 | Fair 9.1% |
| Immigrants | Panama | 24.3 /100 | #197 | Fair 9.1% |
| Guyanese | 21.8 /100 | #198 | Fair 9.1% |
| Czechoslovakians | 20.8 /100 | #199 | Fair 9.1% |
| Trinidadians and Tobagonians | 18.2 /100 | #200 | Poor 9.1% |
| Immigrants | Trinidad and Tobago | 16.7 /100 | #201 | Poor 9.1% |
| Immigrants | Middle Africa | 15.6 /100 | #202 | Poor 9.1% |
| Maltese | 15.3 /100 | #203 | Poor 9.1% |
| Immigrants | Canada | 15.3 /100 | #204 | Poor 9.1% |
| Immigrants | Western Europe | 14.1 /100 | #205 | Poor 9.1% |
| Immigrants | North America | 12.7 /100 | #206 | Poor 9.2% |
| Cubans | 10.9 /100 | #207 | Poor 9.2% |
| Immigrants | Peru | 10.8 /100 | #208 | Poor 9.2% |