Scotch-Irish vs Yuman Female Unemployment
COMPARE
Scotch-Irish
Yuman
Female Unemployment
Female Unemployment Comparison
Scotch-Irish
Yuman
4.8%
FEMALE UNEMPLOYMENT
99.6/ 100
METRIC RATING
39th/ 347
METRIC RANK
9.6%
FEMALE UNEMPLOYMENT
0.0/ 100
METRIC RATING
345th/ 347
METRIC RANK
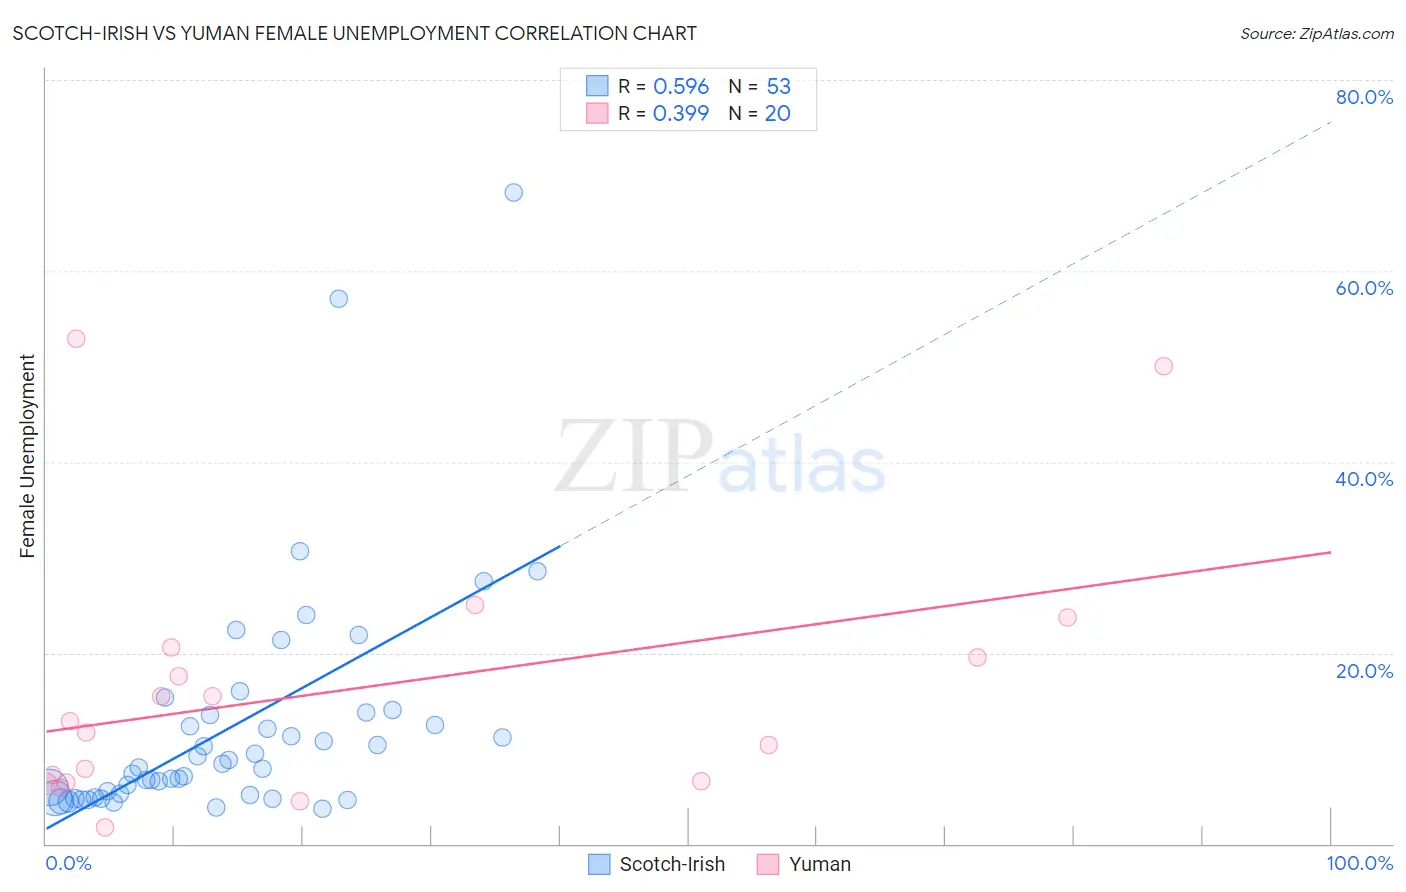
Scotch-Irish vs Yuman Female Unemployment Correlation Chart
The statistical analysis conducted on geographies consisting of 537,046,188 people shows a substantial positive correlation between the proportion of Scotch-Irish and unemploymnet rate among females in the United States with a correlation coefficient (R) of 0.596 and weighted average of 4.8%. Similarly, the statistical analysis conducted on geographies consisting of 40,628,844 people shows a mild positive correlation between the proportion of Yuman and unemploymnet rate among females in the United States with a correlation coefficient (R) of 0.399 and weighted average of 9.6%, a difference of 98.8%.
Female Unemployment Correlation Summary
| Measurement | Scotch-Irish | Yuman |
| Minimum | 3.7% | 1.7% |
| Maximum | 68.2% | 52.9% |
| Range | 64.5% | 51.2% |
| Mean | 12.3% | 16.1% |
| Median | 8.0% | 12.2% |
| Interquartile 25% (IQ1) | 5.0% | 6.5% |
| Interquartile 75% (IQ3) | 13.6% | 20.0% |
| Interquartile Range (IQR) | 8.7% | 13.5% |
| Standard Deviation (Sample) | 12.2% | 13.8% |
| Standard Deviation (Population) | 12.1% | 13.4% |
Similar Demographics by Female Unemployment
Demographics Similar to Scotch-Irish by Female Unemployment
In terms of female unemployment, the demographic groups most similar to Scotch-Irish are Northern European (4.8%, a difference of 0.010%), French (4.8%, a difference of 0.040%), Pennsylvania German (4.8%, a difference of 0.12%), Tongan (4.8%, a difference of 0.30%), and Italian (4.8%, a difference of 0.43%).
| Demographics | Rating | Rank | Female Unemployment |
| Slovaks | 99.8 /100 | #32 | Exceptional 4.8% |
| Czechoslovakians | 99.7 /100 | #33 | Exceptional 4.8% |
| Zimbabweans | 99.7 /100 | #34 | Exceptional 4.8% |
| French Canadians | 99.7 /100 | #35 | Exceptional 4.8% |
| Yugoslavians | 99.7 /100 | #36 | Exceptional 4.8% |
| Pennsylvania Germans | 99.6 /100 | #37 | Exceptional 4.8% |
| Northern Europeans | 99.6 /100 | #38 | Exceptional 4.8% |
| Scotch-Irish | 99.6 /100 | #39 | Exceptional 4.8% |
| French | 99.6 /100 | #40 | Exceptional 4.8% |
| Tongans | 99.5 /100 | #41 | Exceptional 4.8% |
| Italians | 99.5 /100 | #42 | Exceptional 4.8% |
| Eastern Europeans | 99.4 /100 | #43 | Exceptional 4.9% |
| Greeks | 99.4 /100 | #44 | Exceptional 4.9% |
| Austrians | 99.3 /100 | #45 | Exceptional 4.9% |
| Immigrants | Bulgaria | 99.3 /100 | #46 | Exceptional 4.9% |
Demographics Similar to Yuman by Female Unemployment
In terms of female unemployment, the demographic groups most similar to Yuman are Pima (9.3%, a difference of 2.8%), Arapaho (8.8%, a difference of 9.1%), Yup'ik (10.9%, a difference of 13.4%), Puerto Rican (8.3%, a difference of 15.0%), and Inupiat (8.2%, a difference of 17.6%).
| Demographics | Rating | Rank | Female Unemployment |
| Menominee | 0.0 /100 | #333 | Tragic 7.0% |
| Immigrants | Armenia | 0.0 /100 | #334 | Tragic 7.1% |
| Dominicans | 0.0 /100 | #335 | Tragic 7.2% |
| Immigrants | Dominican Republic | 0.0 /100 | #336 | Tragic 7.2% |
| Navajo | 0.0 /100 | #337 | Tragic 7.3% |
| Tohono O'odham | 0.0 /100 | #338 | Tragic 7.7% |
| Immigrants | Yemen | 0.0 /100 | #339 | Tragic 7.8% |
| Hopi | 0.0 /100 | #340 | Tragic 8.1% |
| Inupiat | 0.0 /100 | #341 | Tragic 8.2% |
| Puerto Ricans | 0.0 /100 | #342 | Tragic 8.3% |
| Arapaho | 0.0 /100 | #343 | Tragic 8.8% |
| Pima | 0.0 /100 | #344 | Tragic 9.3% |
| Yuman | 0.0 /100 | #345 | Tragic 9.6% |
| Yup'ik | 0.0 /100 | #346 | Tragic 10.9% |
| Crow | 0.0 /100 | #347 | Tragic 12.1% |