Scotch-Irish vs Immigrants from Ghana Female Unemployment
COMPARE
Scotch-Irish
Immigrants from Ghana
Female Unemployment
Female Unemployment Comparison
Scotch-Irish
Immigrants from Ghana
4.8%
FEMALE UNEMPLOYMENT
99.6/ 100
METRIC RATING
39th/ 347
METRIC RANK
6.0%
FEMALE UNEMPLOYMENT
0.0/ 100
METRIC RATING
277th/ 347
METRIC RANK
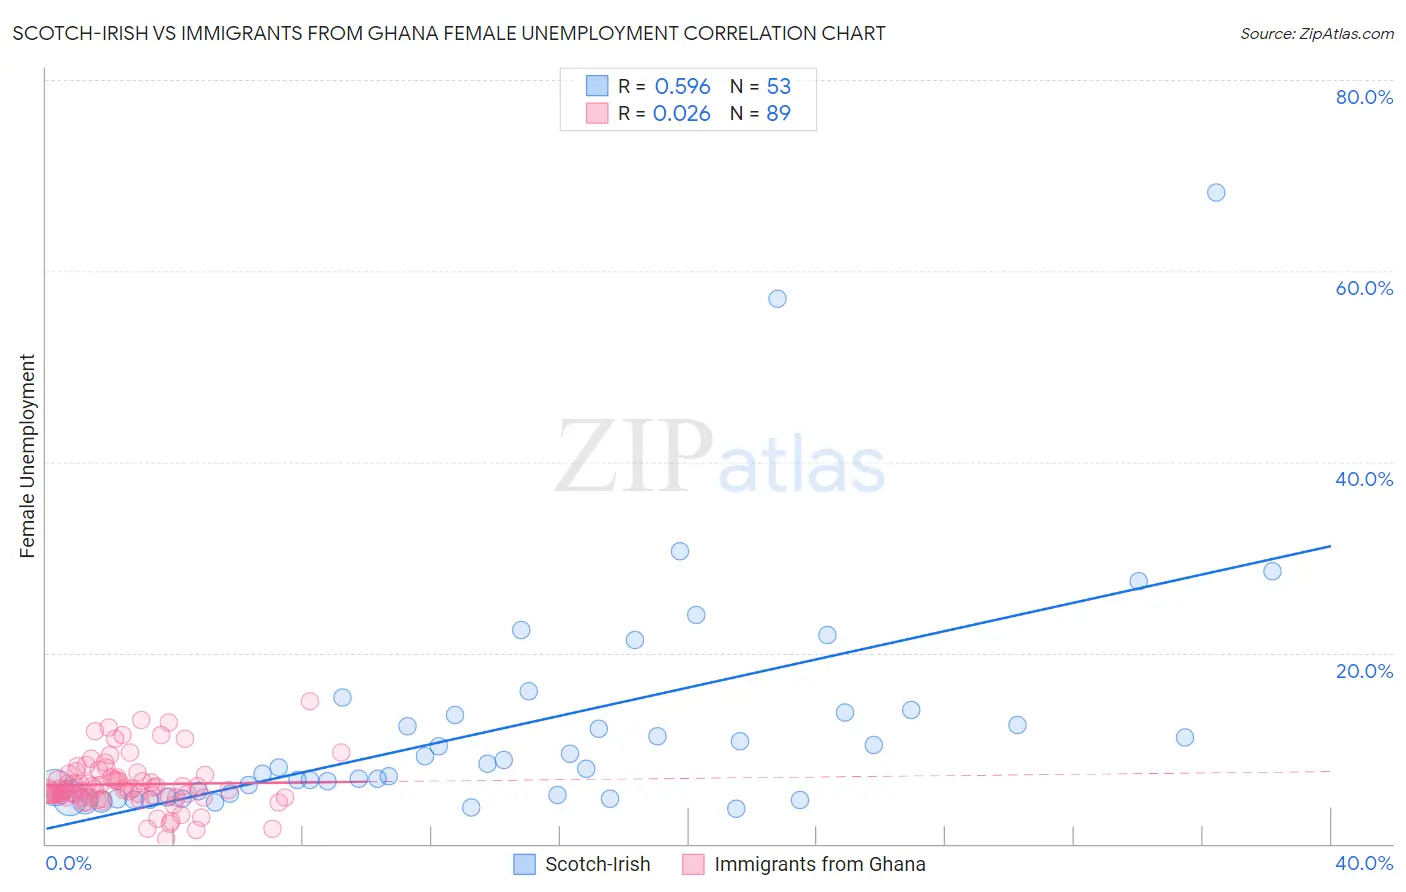
Scotch-Irish vs Immigrants from Ghana Female Unemployment Correlation Chart
The statistical analysis conducted on geographies consisting of 537,046,188 people shows a substantial positive correlation between the proportion of Scotch-Irish and unemploymnet rate among females in the United States with a correlation coefficient (R) of 0.596 and weighted average of 4.8%. Similarly, the statistical analysis conducted on geographies consisting of 199,631,349 people shows no correlation between the proportion of Immigrants from Ghana and unemploymnet rate among females in the United States with a correlation coefficient (R) of 0.026 and weighted average of 6.0%, a difference of 24.5%.
Female Unemployment Correlation Summary
| Measurement | Scotch-Irish | Immigrants from Ghana |
| Minimum | 3.7% | 0.50% |
| Maximum | 68.2% | 14.9% |
| Range | 64.5% | 14.4% |
| Mean | 12.3% | 6.2% |
| Median | 8.0% | 5.7% |
| Interquartile 25% (IQ1) | 5.0% | 4.9% |
| Interquartile 75% (IQ3) | 13.6% | 7.1% |
| Interquartile Range (IQR) | 8.7% | 2.2% |
| Standard Deviation (Sample) | 12.2% | 2.6% |
| Standard Deviation (Population) | 12.1% | 2.6% |
Similar Demographics by Female Unemployment
Demographics Similar to Scotch-Irish by Female Unemployment
In terms of female unemployment, the demographic groups most similar to Scotch-Irish are Northern European (4.8%, a difference of 0.010%), French (4.8%, a difference of 0.040%), Pennsylvania German (4.8%, a difference of 0.12%), Tongan (4.8%, a difference of 0.30%), and Italian (4.8%, a difference of 0.43%).
| Demographics | Rating | Rank | Female Unemployment |
| Slovaks | 99.8 /100 | #32 | Exceptional 4.8% |
| Czechoslovakians | 99.7 /100 | #33 | Exceptional 4.8% |
| Zimbabweans | 99.7 /100 | #34 | Exceptional 4.8% |
| French Canadians | 99.7 /100 | #35 | Exceptional 4.8% |
| Yugoslavians | 99.7 /100 | #36 | Exceptional 4.8% |
| Pennsylvania Germans | 99.6 /100 | #37 | Exceptional 4.8% |
| Northern Europeans | 99.6 /100 | #38 | Exceptional 4.8% |
| Scotch-Irish | 99.6 /100 | #39 | Exceptional 4.8% |
| French | 99.6 /100 | #40 | Exceptional 4.8% |
| Tongans | 99.5 /100 | #41 | Exceptional 4.8% |
| Italians | 99.5 /100 | #42 | Exceptional 4.8% |
| Eastern Europeans | 99.4 /100 | #43 | Exceptional 4.9% |
| Greeks | 99.4 /100 | #44 | Exceptional 4.9% |
| Austrians | 99.3 /100 | #45 | Exceptional 4.9% |
| Immigrants | Bulgaria | 99.3 /100 | #46 | Exceptional 4.9% |
Demographics Similar to Immigrants from Ghana by Female Unemployment
In terms of female unemployment, the demographic groups most similar to Immigrants from Ghana are Yaqui (6.0%, a difference of 0.0%), Armenian (6.0%, a difference of 0.12%), Mexican American Indian (6.0%, a difference of 0.17%), Guatemalan (6.0%, a difference of 0.21%), and Bahamian (6.0%, a difference of 0.40%).
| Demographics | Rating | Rank | Female Unemployment |
| Immigrants | Honduras | 0.0 /100 | #270 | Tragic 5.9% |
| Central Americans | 0.0 /100 | #271 | Tragic 5.9% |
| Lumbee | 0.0 /100 | #272 | Tragic 5.9% |
| Ghanaians | 0.0 /100 | #273 | Tragic 5.9% |
| Africans | 0.0 /100 | #274 | Tragic 5.9% |
| Senegalese | 0.0 /100 | #275 | Tragic 6.0% |
| Bahamians | 0.0 /100 | #276 | Tragic 6.0% |
| Immigrants | Ghana | 0.0 /100 | #277 | Tragic 6.0% |
| Yaqui | 0.0 /100 | #278 | Tragic 6.0% |
| Armenians | 0.0 /100 | #279 | Tragic 6.0% |
| Mexican American Indians | 0.0 /100 | #280 | Tragic 6.0% |
| Guatemalans | 0.0 /100 | #281 | Tragic 6.0% |
| Colville | 0.0 /100 | #282 | Tragic 6.0% |
| Salvadorans | 0.0 /100 | #283 | Tragic 6.0% |
| Immigrants | Senegal | 0.0 /100 | #284 | Tragic 6.1% |