Scotch-Irish vs Subsaharan African Female Unemployment
COMPARE
Scotch-Irish
Subsaharan African
Female Unemployment
Female Unemployment Comparison
Scotch-Irish
Sub-Saharan Africans
4.8%
FEMALE UNEMPLOYMENT
99.6/ 100
METRIC RATING
39th/ 347
METRIC RANK
5.7%
FEMALE UNEMPLOYMENT
0.4/ 100
METRIC RATING
256th/ 347
METRIC RANK
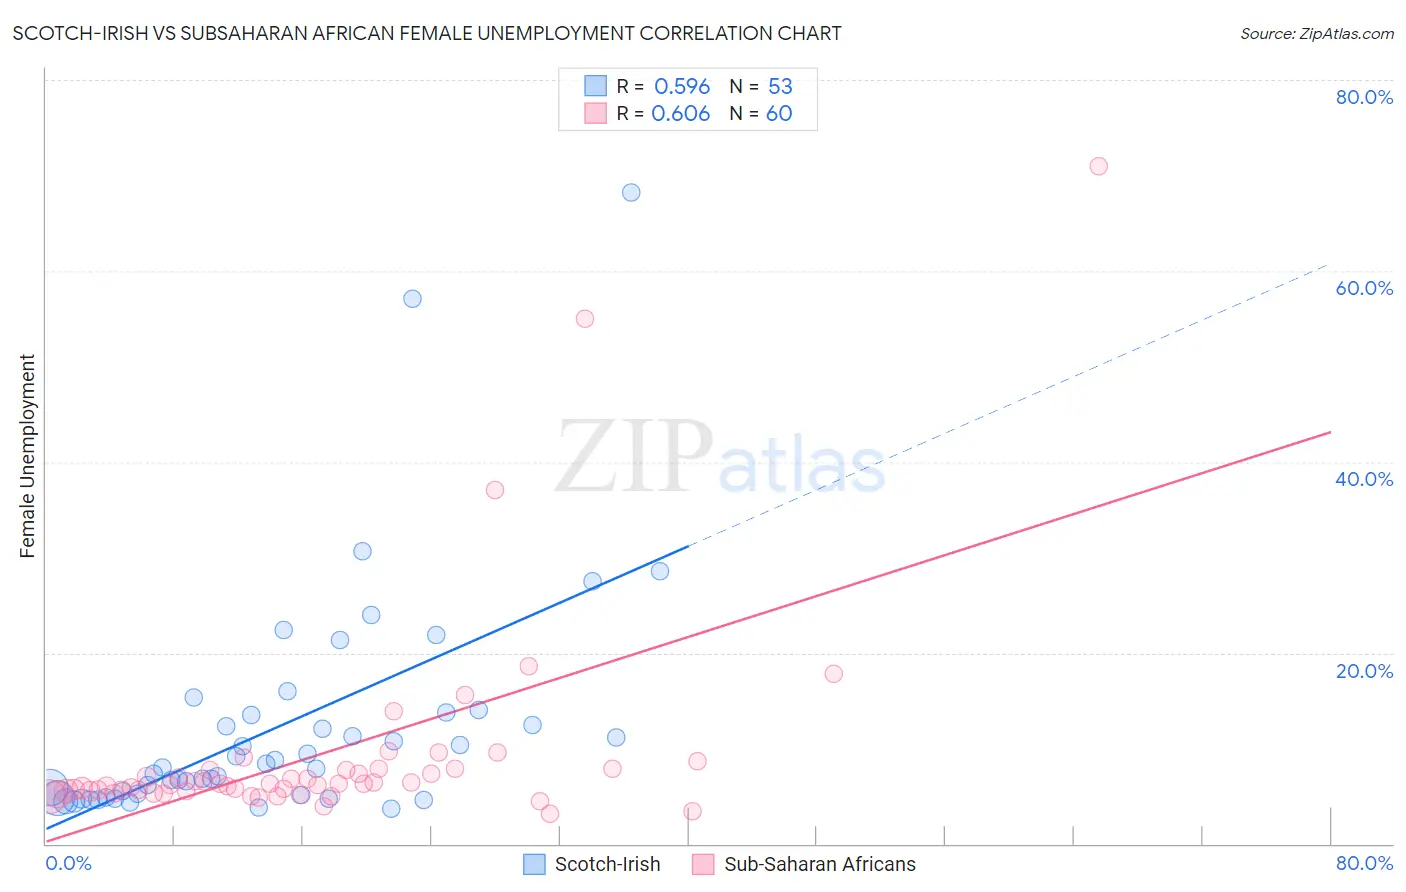
Scotch-Irish vs Subsaharan African Female Unemployment Correlation Chart
The statistical analysis conducted on geographies consisting of 537,046,188 people shows a substantial positive correlation between the proportion of Scotch-Irish and unemploymnet rate among females in the United States with a correlation coefficient (R) of 0.596 and weighted average of 4.8%. Similarly, the statistical analysis conducted on geographies consisting of 503,774,253 people shows a significant positive correlation between the proportion of Sub-Saharan Africans and unemploymnet rate among females in the United States with a correlation coefficient (R) of 0.606 and weighted average of 5.7%, a difference of 18.2%.
Female Unemployment Correlation Summary
| Measurement | Scotch-Irish | Subsaharan African |
| Minimum | 3.7% | 3.1% |
| Maximum | 68.2% | 71.0% |
| Range | 64.5% | 67.9% |
| Mean | 12.3% | 9.3% |
| Median | 8.0% | 6.2% |
| Interquartile 25% (IQ1) | 5.0% | 5.5% |
| Interquartile 75% (IQ3) | 13.6% | 7.8% |
| Interquartile Range (IQR) | 8.7% | 2.3% |
| Standard Deviation (Sample) | 12.2% | 11.3% |
| Standard Deviation (Population) | 12.1% | 11.2% |
Similar Demographics by Female Unemployment
Demographics Similar to Scotch-Irish by Female Unemployment
In terms of female unemployment, the demographic groups most similar to Scotch-Irish are Northern European (4.8%, a difference of 0.010%), French (4.8%, a difference of 0.040%), Pennsylvania German (4.8%, a difference of 0.12%), Tongan (4.8%, a difference of 0.30%), and Italian (4.8%, a difference of 0.43%).
| Demographics | Rating | Rank | Female Unemployment |
| Slovaks | 99.8 /100 | #32 | Exceptional 4.8% |
| Czechoslovakians | 99.7 /100 | #33 | Exceptional 4.8% |
| Zimbabweans | 99.7 /100 | #34 | Exceptional 4.8% |
| French Canadians | 99.7 /100 | #35 | Exceptional 4.8% |
| Yugoslavians | 99.7 /100 | #36 | Exceptional 4.8% |
| Pennsylvania Germans | 99.6 /100 | #37 | Exceptional 4.8% |
| Northern Europeans | 99.6 /100 | #38 | Exceptional 4.8% |
| Scotch-Irish | 99.6 /100 | #39 | Exceptional 4.8% |
| French | 99.6 /100 | #40 | Exceptional 4.8% |
| Tongans | 99.5 /100 | #41 | Exceptional 4.8% |
| Italians | 99.5 /100 | #42 | Exceptional 4.8% |
| Eastern Europeans | 99.4 /100 | #43 | Exceptional 4.9% |
| Greeks | 99.4 /100 | #44 | Exceptional 4.9% |
| Austrians | 99.3 /100 | #45 | Exceptional 4.9% |
| Immigrants | Bulgaria | 99.3 /100 | #46 | Exceptional 4.9% |
Demographics Similar to Sub-Saharan Africans by Female Unemployment
In terms of female unemployment, the demographic groups most similar to Sub-Saharan Africans are Dutch West Indian (5.7%, a difference of 0.070%), Immigrants from Cameroon (5.7%, a difference of 0.67%), Immigrants from Sierra Leone (5.7%, a difference of 0.71%), Immigrants (5.7%, a difference of 0.71%), and Cajun (5.7%, a difference of 0.85%).
| Demographics | Rating | Rank | Female Unemployment |
| Immigrants | Uzbekistan | 1.0 /100 | #249 | Tragic 5.6% |
| Immigrants | Syria | 0.8 /100 | #250 | Tragic 5.6% |
| Assyrians/Chaldeans/Syriacs | 0.8 /100 | #251 | Tragic 5.6% |
| Cajuns | 0.7 /100 | #252 | Tragic 5.7% |
| Immigrants | Sierra Leone | 0.6 /100 | #253 | Tragic 5.7% |
| Immigrants | Immigrants | 0.6 /100 | #254 | Tragic 5.7% |
| Immigrants | Cameroon | 0.6 /100 | #255 | Tragic 5.7% |
| Sub-Saharan Africans | 0.4 /100 | #256 | Tragic 5.7% |
| Dutch West Indians | 0.3 /100 | #257 | Tragic 5.7% |
| Immigrants | Portugal | 0.2 /100 | #258 | Tragic 5.8% |
| Immigrants | Fiji | 0.2 /100 | #259 | Tragic 5.8% |
| Nigerians | 0.2 /100 | #260 | Tragic 5.8% |
| Kiowa | 0.1 /100 | #261 | Tragic 5.8% |
| Immigrants | Nigeria | 0.1 /100 | #262 | Tragic 5.8% |
| Immigrants | Azores | 0.1 /100 | #263 | Tragic 5.8% |