Scotch-Irish vs Houma Unemployment Among Youth under 25 years
COMPARE
Scotch-Irish
Houma
Unemployment Among Youth under 25 years
Unemployment Among Youth under 25 years Comparison
Scotch-Irish
Houma
11.1%
UNEMPLOYMENT AMONG YOUTH UNDER 25 YEARS
98.8/ 100
METRIC RATING
58th/ 347
METRIC RANK
13.8%
UNEMPLOYMENT AMONG YOUTH UNDER 25 YEARS
0.0/ 100
METRIC RATING
304th/ 347
METRIC RANK
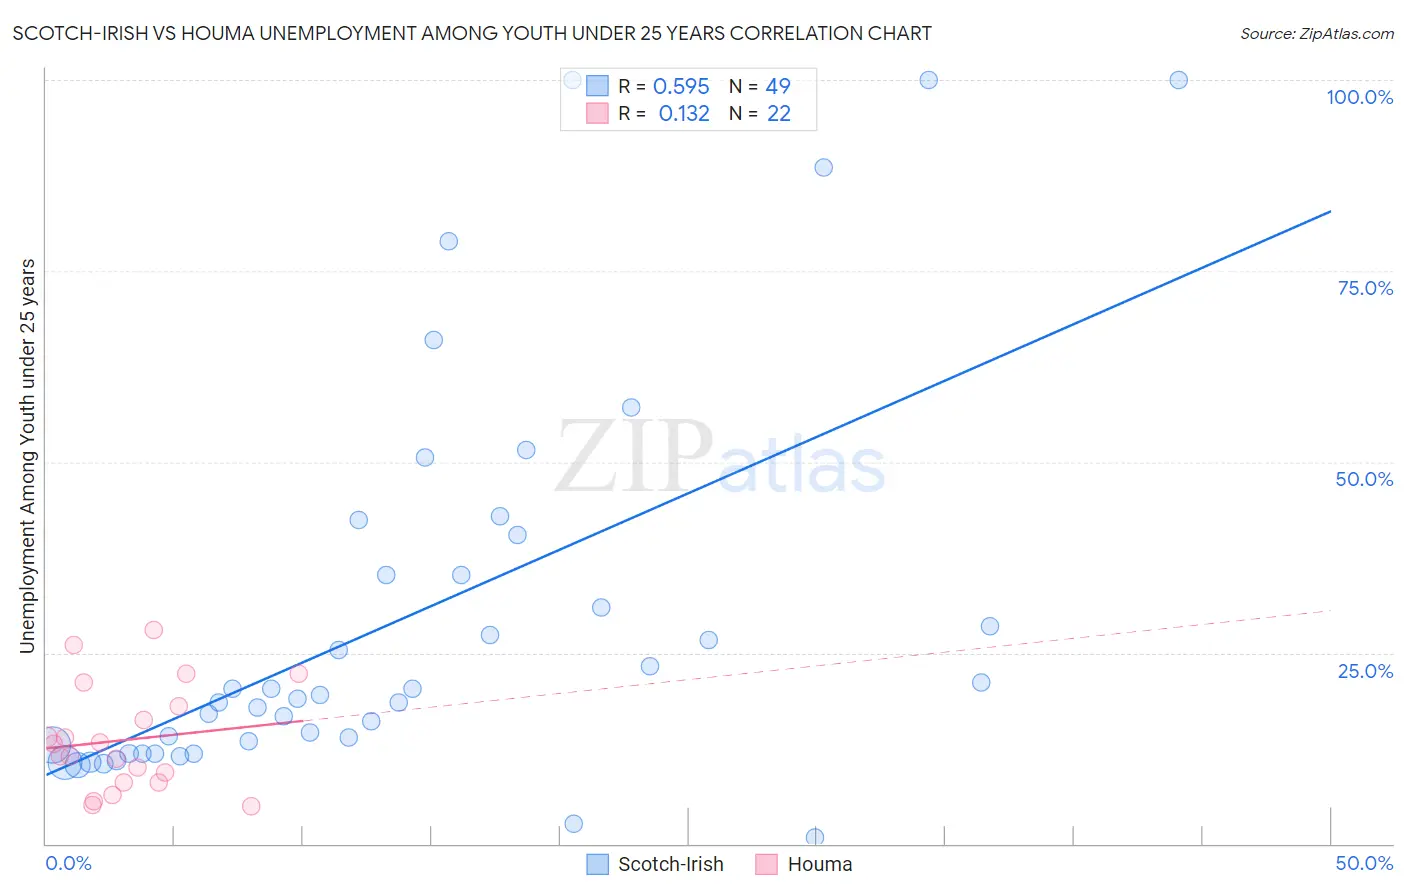
Scotch-Irish vs Houma Unemployment Among Youth under 25 years Correlation Chart
The statistical analysis conducted on geographies consisting of 527,464,403 people shows a substantial positive correlation between the proportion of Scotch-Irish and unemployment rate among youth under the age of 25 in the United States with a correlation coefficient (R) of 0.595 and weighted average of 11.1%. Similarly, the statistical analysis conducted on geographies consisting of 36,647,392 people shows a poor positive correlation between the proportion of Houma and unemployment rate among youth under the age of 25 in the United States with a correlation coefficient (R) of 0.132 and weighted average of 13.8%, a difference of 24.8%.
Unemployment Among Youth under 25 years Correlation Summary
| Measurement | Scotch-Irish | Houma |
| Minimum | 0.80% | 4.9% |
| Maximum | 100.0% | 28.0% |
| Range | 99.2% | 23.1% |
| Mean | 29.8% | 13.6% |
| Median | 19.4% | 12.2% |
| Interquartile 25% (IQ1) | 12.4% | 8.0% |
| Interquartile 75% (IQ3) | 37.9% | 18.0% |
| Interquartile Range (IQR) | 25.5% | 10.0% |
| Standard Deviation (Sample) | 25.8% | 6.8% |
| Standard Deviation (Population) | 25.6% | 6.6% |
Similar Demographics by Unemployment Among Youth under 25 years
Demographics Similar to Scotch-Irish by Unemployment Among Youth under 25 years
In terms of unemployment among youth under 25 years, the demographic groups most similar to Scotch-Irish are Immigrants from Eritrea (11.1%, a difference of 0.040%), Immigrants from Saudi Arabia (11.1%, a difference of 0.050%), Immigrants from Eastern Africa (11.1%, a difference of 0.060%), Mongolian (11.1%, a difference of 0.070%), and Irish (11.1%, a difference of 0.070%).
| Demographics | Rating | Rank | Unemployment Among Youth under 25 years |
| Serbians | 99.0 /100 | #51 | Exceptional 11.0% |
| Latvians | 99.0 /100 | #52 | Exceptional 11.0% |
| Ottawa | 99.0 /100 | #53 | Exceptional 11.1% |
| Mongolians | 98.9 /100 | #54 | Exceptional 11.1% |
| Irish | 98.9 /100 | #55 | Exceptional 11.1% |
| Immigrants | Saudi Arabia | 98.8 /100 | #56 | Exceptional 11.1% |
| Immigrants | Eritrea | 98.8 /100 | #57 | Exceptional 11.1% |
| Scotch-Irish | 98.8 /100 | #58 | Exceptional 11.1% |
| Immigrants | Eastern Africa | 98.7 /100 | #59 | Exceptional 11.1% |
| South Africans | 98.5 /100 | #60 | Exceptional 11.1% |
| Filipinos | 98.3 /100 | #61 | Exceptional 11.1% |
| Immigrants | Netherlands | 98.1 /100 | #62 | Exceptional 11.1% |
| Immigrants | Croatia | 98.1 /100 | #63 | Exceptional 11.1% |
| Jordanians | 97.9 /100 | #64 | Exceptional 11.1% |
| Immigrants | Singapore | 97.8 /100 | #65 | Exceptional 11.2% |
Demographics Similar to Houma by Unemployment Among Youth under 25 years
In terms of unemployment among youth under 25 years, the demographic groups most similar to Houma are Belizean (13.8%, a difference of 0.010%), Immigrants from Sierra Leone (13.8%, a difference of 0.040%), Immigrants from Senegal (13.8%, a difference of 0.090%), Immigrants from Cabo Verde (13.8%, a difference of 0.26%), and Haitian (13.9%, a difference of 0.33%).
| Demographics | Rating | Rank | Unemployment Among Youth under 25 years |
| U.S. Virgin Islanders | 0.0 /100 | #297 | Tragic 13.6% |
| Shoshone | 0.0 /100 | #298 | Tragic 13.7% |
| Tohono O'odham | 0.0 /100 | #299 | Tragic 13.8% |
| Immigrants | Cabo Verde | 0.0 /100 | #300 | Tragic 13.8% |
| Immigrants | Senegal | 0.0 /100 | #301 | Tragic 13.8% |
| Immigrants | Sierra Leone | 0.0 /100 | #302 | Tragic 13.8% |
| Belizeans | 0.0 /100 | #303 | Tragic 13.8% |
| Houma | 0.0 /100 | #304 | Tragic 13.8% |
| Haitians | 0.0 /100 | #305 | Tragic 13.9% |
| Pueblo | 0.0 /100 | #306 | Tragic 13.9% |
| Immigrants | Haiti | 0.0 /100 | #307 | Tragic 14.0% |
| Immigrants | Belize | 0.0 /100 | #308 | Tragic 14.0% |
| Aleuts | 0.0 /100 | #309 | Tragic 14.1% |
| Immigrants | West Indies | 0.0 /100 | #310 | Tragic 14.2% |
| Immigrants | Bangladesh | 0.0 /100 | #311 | Tragic 14.2% |