Scotch-Irish vs African Unemployment Among Youth under 25 years
COMPARE
Scotch-Irish
African
Unemployment Among Youth under 25 years
Unemployment Among Youth under 25 years Comparison
Scotch-Irish
Africans
11.1%
UNEMPLOYMENT AMONG YOUTH UNDER 25 YEARS
98.8/ 100
METRIC RATING
58th/ 347
METRIC RANK
13.2%
UNEMPLOYMENT AMONG YOUTH UNDER 25 YEARS
0.0/ 100
METRIC RATING
278th/ 347
METRIC RANK
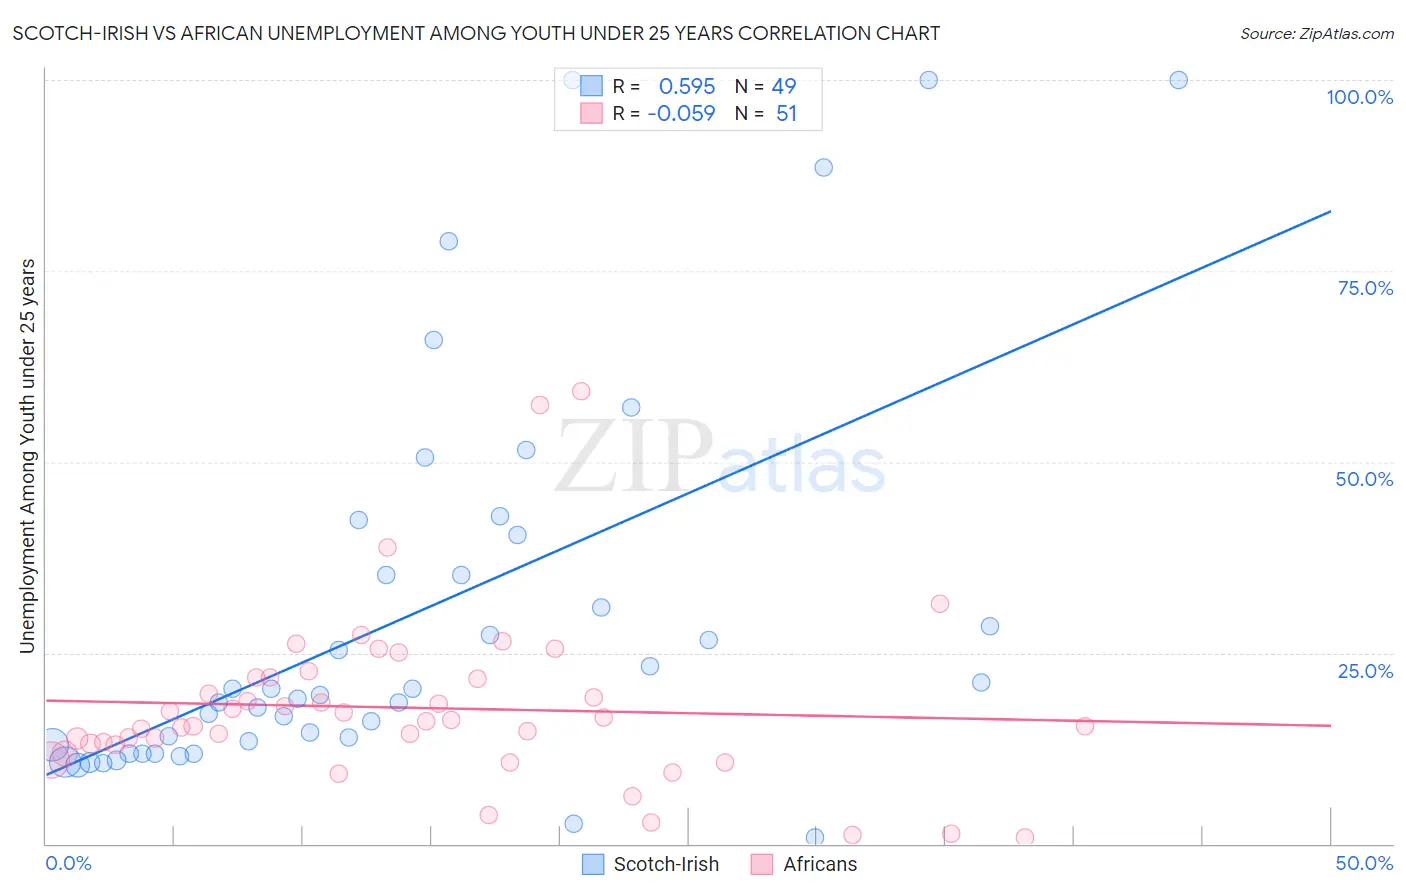
Scotch-Irish vs African Unemployment Among Youth under 25 years Correlation Chart
The statistical analysis conducted on geographies consisting of 527,464,403 people shows a substantial positive correlation between the proportion of Scotch-Irish and unemployment rate among youth under the age of 25 in the United States with a correlation coefficient (R) of 0.595 and weighted average of 11.1%. Similarly, the statistical analysis conducted on geographies consisting of 462,952,151 people shows a slight negative correlation between the proportion of Africans and unemployment rate among youth under the age of 25 in the United States with a correlation coefficient (R) of -0.059 and weighted average of 13.2%, a difference of 18.8%.
Unemployment Among Youth under 25 years Correlation Summary
| Measurement | Scotch-Irish | African |
| Minimum | 0.80% | 0.80% |
| Maximum | 100.0% | 59.3% |
| Range | 99.2% | 58.5% |
| Mean | 29.8% | 17.8% |
| Median | 19.4% | 16.0% |
| Interquartile 25% (IQ1) | 12.4% | 13.0% |
| Interquartile 75% (IQ3) | 37.9% | 21.7% |
| Interquartile Range (IQR) | 25.5% | 8.7% |
| Standard Deviation (Sample) | 25.8% | 11.2% |
| Standard Deviation (Population) | 25.6% | 11.1% |
Similar Demographics by Unemployment Among Youth under 25 years
Demographics Similar to Scotch-Irish by Unemployment Among Youth under 25 years
In terms of unemployment among youth under 25 years, the demographic groups most similar to Scotch-Irish are Immigrants from Eritrea (11.1%, a difference of 0.040%), Immigrants from Saudi Arabia (11.1%, a difference of 0.050%), Immigrants from Eastern Africa (11.1%, a difference of 0.060%), Mongolian (11.1%, a difference of 0.070%), and Irish (11.1%, a difference of 0.070%).
| Demographics | Rating | Rank | Unemployment Among Youth under 25 years |
| Serbians | 99.0 /100 | #51 | Exceptional 11.0% |
| Latvians | 99.0 /100 | #52 | Exceptional 11.0% |
| Ottawa | 99.0 /100 | #53 | Exceptional 11.1% |
| Mongolians | 98.9 /100 | #54 | Exceptional 11.1% |
| Irish | 98.9 /100 | #55 | Exceptional 11.1% |
| Immigrants | Saudi Arabia | 98.8 /100 | #56 | Exceptional 11.1% |
| Immigrants | Eritrea | 98.8 /100 | #57 | Exceptional 11.1% |
| Scotch-Irish | 98.8 /100 | #58 | Exceptional 11.1% |
| Immigrants | Eastern Africa | 98.7 /100 | #59 | Exceptional 11.1% |
| South Africans | 98.5 /100 | #60 | Exceptional 11.1% |
| Filipinos | 98.3 /100 | #61 | Exceptional 11.1% |
| Immigrants | Netherlands | 98.1 /100 | #62 | Exceptional 11.1% |
| Immigrants | Croatia | 98.1 /100 | #63 | Exceptional 11.1% |
| Jordanians | 97.9 /100 | #64 | Exceptional 11.1% |
| Immigrants | Singapore | 97.8 /100 | #65 | Exceptional 11.2% |
Demographics Similar to Africans by Unemployment Among Youth under 25 years
In terms of unemployment among youth under 25 years, the demographic groups most similar to Africans are Bahamian (13.1%, a difference of 0.26%), Immigrants from Uzbekistan (13.1%, a difference of 0.42%), Cajun (13.2%, a difference of 0.67%), Bermudan (13.0%, a difference of 0.85%), and Ute (13.3%, a difference of 0.92%).
| Demographics | Rating | Rank | Unemployment Among Youth under 25 years |
| Immigrants | Bahamas | 0.0 /100 | #271 | Tragic 12.9% |
| Cape Verdeans | 0.0 /100 | #272 | Tragic 12.9% |
| Nigerians | 0.0 /100 | #273 | Tragic 13.0% |
| Immigrants | Nigeria | 0.0 /100 | #274 | Tragic 13.0% |
| Bermudans | 0.0 /100 | #275 | Tragic 13.0% |
| Immigrants | Uzbekistan | 0.0 /100 | #276 | Tragic 13.1% |
| Bahamians | 0.0 /100 | #277 | Tragic 13.1% |
| Africans | 0.0 /100 | #278 | Tragic 13.2% |
| Cajuns | 0.0 /100 | #279 | Tragic 13.2% |
| Ute | 0.0 /100 | #280 | Tragic 13.3% |
| Armenians | 0.0 /100 | #281 | Tragic 13.3% |
| Sierra Leoneans | 0.0 /100 | #282 | Tragic 13.3% |
| Immigrants | Cameroon | 0.0 /100 | #283 | Tragic 13.3% |
| Lumbee | 0.0 /100 | #284 | Tragic 13.3% |
| Ghanaians | 0.0 /100 | #285 | Tragic 13.3% |