Hopi vs Houma Unemployment Among Youth under 25 years
COMPARE
Hopi
Houma
Unemployment Among Youth under 25 years
Unemployment Among Youth under 25 years Comparison
Hopi
Houma
21.5%
UNEMPLOYMENT AMONG YOUTH UNDER 25 YEARS
0.0/ 100
METRIC RATING
345th/ 347
METRIC RANK
13.8%
UNEMPLOYMENT AMONG YOUTH UNDER 25 YEARS
0.0/ 100
METRIC RATING
304th/ 347
METRIC RANK
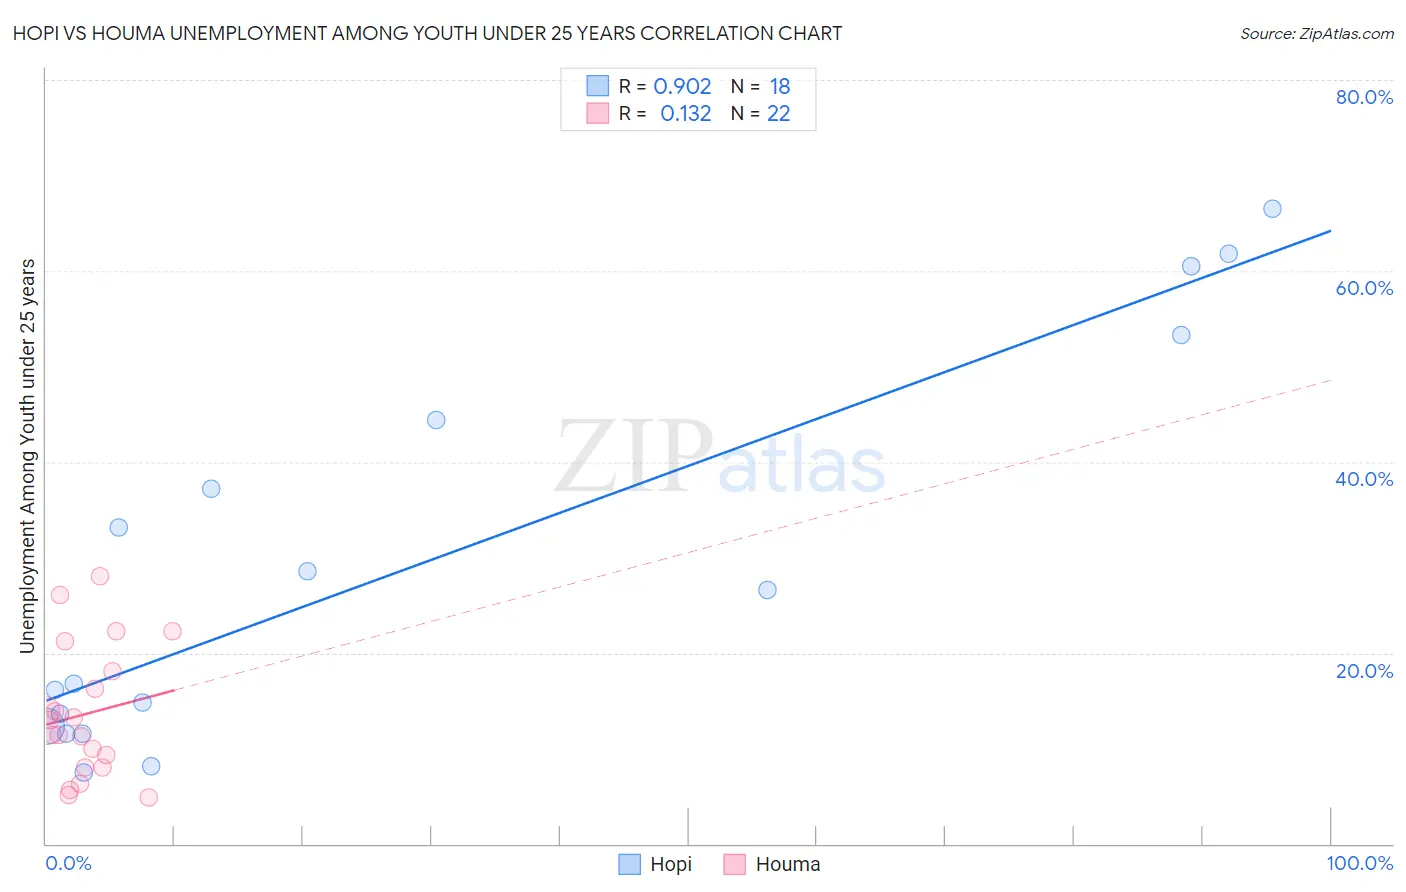
Hopi vs Houma Unemployment Among Youth under 25 years Correlation Chart
The statistical analysis conducted on geographies consisting of 74,569,611 people shows a near-perfect positive correlation between the proportion of Hopi and unemployment rate among youth under the age of 25 in the United States with a correlation coefficient (R) of 0.902 and weighted average of 21.5%. Similarly, the statistical analysis conducted on geographies consisting of 36,647,392 people shows a poor positive correlation between the proportion of Houma and unemployment rate among youth under the age of 25 in the United States with a correlation coefficient (R) of 0.132 and weighted average of 13.8%, a difference of 55.2%.
Unemployment Among Youth under 25 years Correlation Summary
| Measurement | Hopi | Houma |
| Minimum | 7.5% | 4.9% |
| Maximum | 66.5% | 28.0% |
| Range | 59.0% | 23.1% |
| Mean | 29.1% | 13.6% |
| Median | 21.7% | 12.2% |
| Interquartile 25% (IQ1) | 12.3% | 8.0% |
| Interquartile 75% (IQ3) | 44.4% | 18.0% |
| Interquartile Range (IQR) | 32.1% | 10.0% |
| Standard Deviation (Sample) | 20.2% | 6.8% |
| Standard Deviation (Population) | 19.6% | 6.6% |
Similar Demographics by Unemployment Among Youth under 25 years
Demographics Similar to Hopi by Unemployment Among Youth under 25 years
In terms of unemployment among youth under 25 years, the demographic groups most similar to Hopi are Inupiat (22.0%, a difference of 2.5%), Crow (20.1%, a difference of 7.0%), Yup'ik (23.7%, a difference of 10.6%), Navajo (18.6%, a difference of 15.3%), and Puerto Rican (18.4%, a difference of 16.6%).
| Demographics | Rating | Rank | Unemployment Among Youth under 25 years |
| Guyanese | 0.0 /100 | #333 | Tragic 15.9% |
| Immigrants | Guyana | 0.0 /100 | #334 | Tragic 15.9% |
| Immigrants | St. Vincent and the Grenadines | 0.0 /100 | #335 | Tragic 16.1% |
| Pima | 0.0 /100 | #336 | Tragic 16.2% |
| Arapaho | 0.0 /100 | #337 | Tragic 16.3% |
| Yuman | 0.0 /100 | #338 | Tragic 16.3% |
| Tsimshian | 0.0 /100 | #339 | Tragic 16.5% |
| Colville | 0.0 /100 | #340 | Tragic 16.8% |
| Paiute | 0.0 /100 | #341 | Tragic 17.6% |
| Puerto Ricans | 0.0 /100 | #342 | Tragic 18.4% |
| Navajo | 0.0 /100 | #343 | Tragic 18.6% |
| Crow | 0.0 /100 | #344 | Tragic 20.1% |
| Hopi | 0.0 /100 | #345 | Tragic 21.5% |
| Inupiat | 0.0 /100 | #346 | Tragic 22.0% |
| Yup'ik | 0.0 /100 | #347 | Tragic 23.7% |
Demographics Similar to Houma by Unemployment Among Youth under 25 years
In terms of unemployment among youth under 25 years, the demographic groups most similar to Houma are Belizean (13.8%, a difference of 0.010%), Immigrants from Sierra Leone (13.8%, a difference of 0.040%), Immigrants from Senegal (13.8%, a difference of 0.090%), Immigrants from Cabo Verde (13.8%, a difference of 0.26%), and Haitian (13.9%, a difference of 0.33%).
| Demographics | Rating | Rank | Unemployment Among Youth under 25 years |
| U.S. Virgin Islanders | 0.0 /100 | #297 | Tragic 13.6% |
| Shoshone | 0.0 /100 | #298 | Tragic 13.7% |
| Tohono O'odham | 0.0 /100 | #299 | Tragic 13.8% |
| Immigrants | Cabo Verde | 0.0 /100 | #300 | Tragic 13.8% |
| Immigrants | Senegal | 0.0 /100 | #301 | Tragic 13.8% |
| Immigrants | Sierra Leone | 0.0 /100 | #302 | Tragic 13.8% |
| Belizeans | 0.0 /100 | #303 | Tragic 13.8% |
| Houma | 0.0 /100 | #304 | Tragic 13.8% |
| Haitians | 0.0 /100 | #305 | Tragic 13.9% |
| Pueblo | 0.0 /100 | #306 | Tragic 13.9% |
| Immigrants | Haiti | 0.0 /100 | #307 | Tragic 14.0% |
| Immigrants | Belize | 0.0 /100 | #308 | Tragic 14.0% |
| Aleuts | 0.0 /100 | #309 | Tragic 14.1% |
| Immigrants | West Indies | 0.0 /100 | #310 | Tragic 14.2% |
| Immigrants | Bangladesh | 0.0 /100 | #311 | Tragic 14.2% |