Scotch-Irish vs Burmese Unemployment Among Seniors over 65 years
COMPARE
Scotch-Irish
Burmese
Unemployment Among Seniors over 65 years
Unemployment Among Seniors over 65 years Comparison
Scotch-Irish
Burmese
4.9%
UNEMPLOYMENT AMONG SENIORS OVER 65 YEARS
99.9/ 100
METRIC RATING
51st/ 347
METRIC RANK
5.0%
UNEMPLOYMENT AMONG SENIORS OVER 65 YEARS
96.8/ 100
METRIC RATING
94th/ 347
METRIC RANK
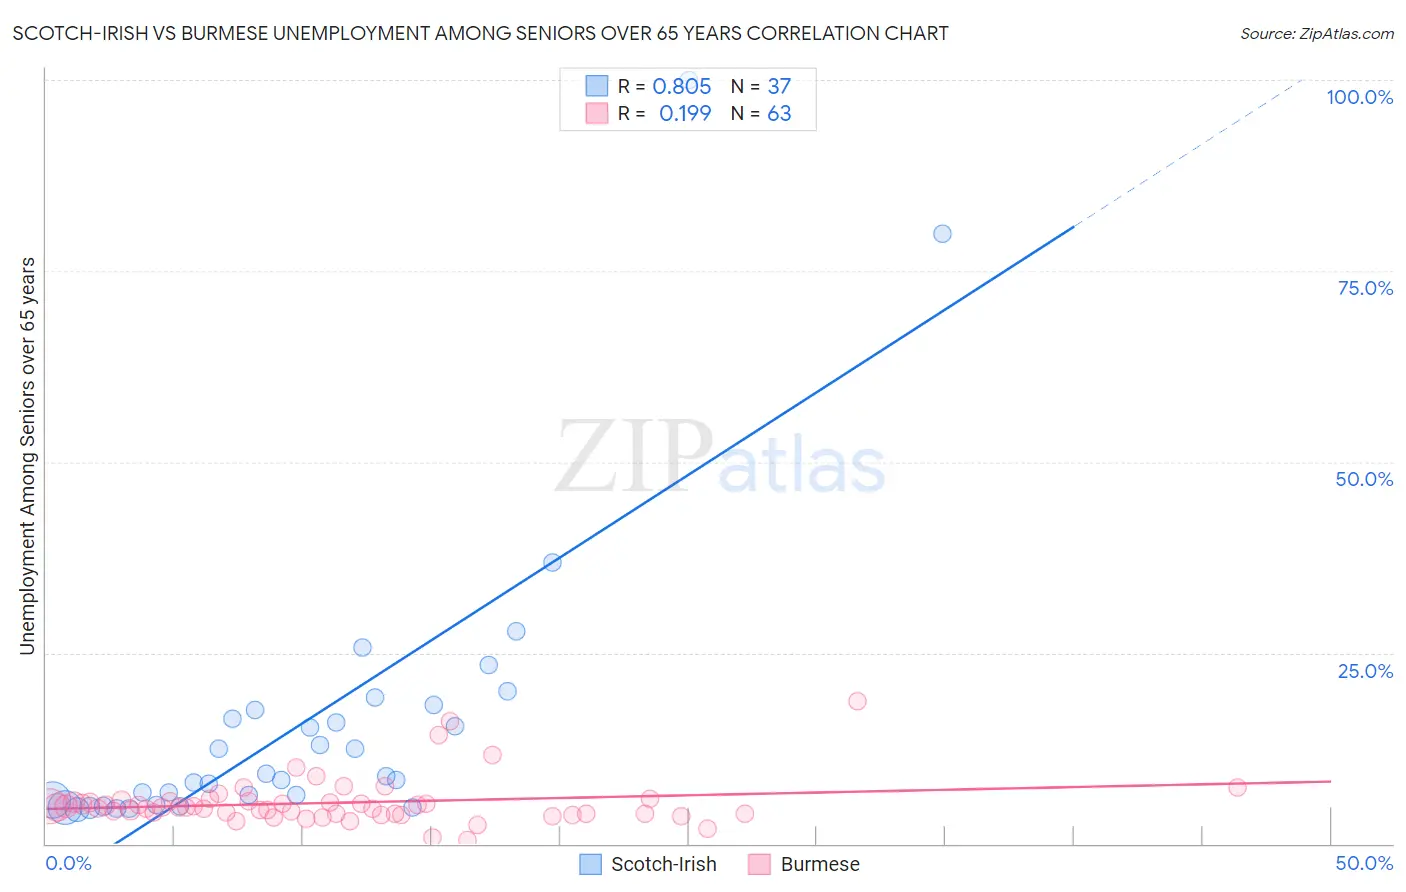
Scotch-Irish vs Burmese Unemployment Among Seniors over 65 years Correlation Chart
The statistical analysis conducted on geographies consisting of 447,057,926 people shows a very strong positive correlation between the proportion of Scotch-Irish and unemployment rate amomg seniors over the age of 65 in the United States with a correlation coefficient (R) of 0.805 and weighted average of 4.9%. Similarly, the statistical analysis conducted on geographies consisting of 408,115,925 people shows a poor positive correlation between the proportion of Burmese and unemployment rate amomg seniors over the age of 65 in the United States with a correlation coefficient (R) of 0.199 and weighted average of 5.0%, a difference of 2.6%.
Unemployment Among Seniors over 65 years Correlation Summary
| Measurement | Scotch-Irish | Burmese |
| Minimum | 4.4% | 0.50% |
| Maximum | 100.0% | 18.7% |
| Range | 95.6% | 18.2% |
| Mean | 16.1% | 5.4% |
| Median | 8.9% | 4.8% |
| Interquartile 25% (IQ1) | 5.4% | 3.9% |
| Interquartile 75% (IQ3) | 17.8% | 5.5% |
| Interquartile Range (IQR) | 12.3% | 1.6% |
| Standard Deviation (Sample) | 19.6% | 3.1% |
| Standard Deviation (Population) | 19.4% | 3.1% |
Similar Demographics by Unemployment Among Seniors over 65 years
Demographics Similar to Scotch-Irish by Unemployment Among Seniors over 65 years
In terms of unemployment among seniors over 65 years, the demographic groups most similar to Scotch-Irish are Swedish (4.9%, a difference of 0.020%), Immigrants from Sudan (4.9%, a difference of 0.060%), Immigrants from Austria (4.9%, a difference of 0.12%), Immigrants from Iraq (4.9%, a difference of 0.12%), and Immigrants from Kenya (4.9%, a difference of 0.13%).
| Demographics | Rating | Rank | Unemployment Among Seniors over 65 years |
| Jordanians | 99.9 /100 | #44 | Exceptional 4.9% |
| Ethiopians | 99.9 /100 | #45 | Exceptional 4.9% |
| Immigrants | Jordan | 99.9 /100 | #46 | Exceptional 4.9% |
| Germans | 99.9 /100 | #47 | Exceptional 4.9% |
| Choctaw | 99.9 /100 | #48 | Exceptional 4.9% |
| Immigrants | Kenya | 99.9 /100 | #49 | Exceptional 4.9% |
| Immigrants | Austria | 99.9 /100 | #50 | Exceptional 4.9% |
| Scotch-Irish | 99.9 /100 | #51 | Exceptional 4.9% |
| Swedes | 99.9 /100 | #52 | Exceptional 4.9% |
| Immigrants | Sudan | 99.8 /100 | #53 | Exceptional 4.9% |
| Immigrants | Iraq | 99.8 /100 | #54 | Exceptional 4.9% |
| Europeans | 99.8 /100 | #55 | Exceptional 4.9% |
| Carpatho Rusyns | 99.8 /100 | #56 | Exceptional 4.9% |
| Danes | 99.8 /100 | #57 | Exceptional 4.9% |
| Scandinavians | 99.8 /100 | #58 | Exceptional 4.9% |
Demographics Similar to Burmese by Unemployment Among Seniors over 65 years
In terms of unemployment among seniors over 65 years, the demographic groups most similar to Burmese are Assyrian/Chaldean/Syriac (5.0%, a difference of 0.010%), Immigrants from Singapore (5.0%, a difference of 0.020%), Immigrants from Oceania (5.0%, a difference of 0.020%), Czechoslovakian (5.0%, a difference of 0.030%), and South African (5.0%, a difference of 0.080%).
| Demographics | Rating | Rank | Unemployment Among Seniors over 65 years |
| Immigrants | Switzerland | 98.2 /100 | #87 | Exceptional 5.0% |
| Afghans | 97.6 /100 | #88 | Exceptional 5.0% |
| Immigrants | South Central Asia | 97.6 /100 | #89 | Exceptional 5.0% |
| Immigrants | South Africa | 97.6 /100 | #90 | Exceptional 5.0% |
| Immigrants | Bolivia | 97.3 /100 | #91 | Exceptional 5.0% |
| Immigrants | Bulgaria | 97.3 /100 | #92 | Exceptional 5.0% |
| Austrians | 97.3 /100 | #93 | Exceptional 5.0% |
| Burmese | 96.8 /100 | #94 | Exceptional 5.0% |
| Assyrians/Chaldeans/Syriacs | 96.8 /100 | #95 | Exceptional 5.0% |
| Immigrants | Singapore | 96.8 /100 | #96 | Exceptional 5.0% |
| Immigrants | Oceania | 96.8 /100 | #97 | Exceptional 5.0% |
| Czechoslovakians | 96.7 /100 | #98 | Exceptional 5.0% |
| South Africans | 96.5 /100 | #99 | Exceptional 5.0% |
| Romanians | 95.5 /100 | #100 | Exceptional 5.0% |
| Yugoslavians | 95.4 /100 | #101 | Exceptional 5.0% |