Immigrants from Germany vs Burmese Unemployment Among Seniors over 65 years
COMPARE
Immigrants from Germany
Burmese
Unemployment Among Seniors over 65 years
Unemployment Among Seniors over 65 years Comparison
Immigrants from Germany
Burmese
5.0%
UNEMPLOYMENT AMONG SENIORS OVER 65 YEARS
93.2/ 100
METRIC RATING
107th/ 347
METRIC RANK
5.0%
UNEMPLOYMENT AMONG SENIORS OVER 65 YEARS
96.8/ 100
METRIC RATING
94th/ 347
METRIC RANK
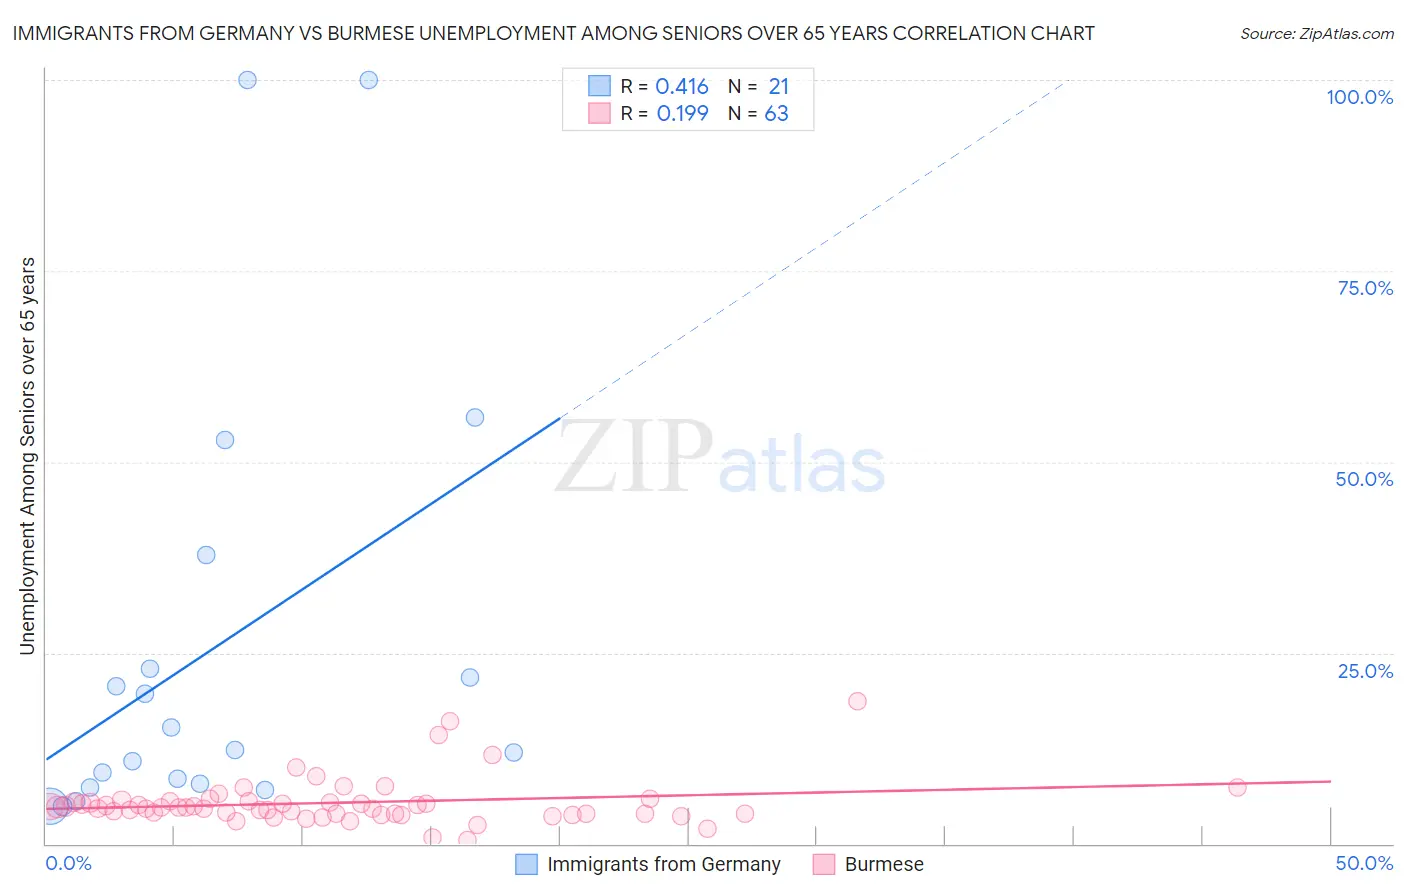
Immigrants from Germany vs Burmese Unemployment Among Seniors over 65 years Correlation Chart
The statistical analysis conducted on geographies consisting of 406,403,898 people shows a moderate positive correlation between the proportion of Immigrants from Germany and unemployment rate amomg seniors over the age of 65 in the United States with a correlation coefficient (R) of 0.416 and weighted average of 5.0%. Similarly, the statistical analysis conducted on geographies consisting of 408,115,925 people shows a poor positive correlation between the proportion of Burmese and unemployment rate amomg seniors over the age of 65 in the United States with a correlation coefficient (R) of 0.199 and weighted average of 5.0%, a difference of 0.66%.
Unemployment Among Seniors over 65 years Correlation Summary
| Measurement | Immigrants from Germany | Burmese |
| Minimum | 4.9% | 0.50% |
| Maximum | 100.0% | 18.7% |
| Range | 95.1% | 18.2% |
| Mean | 25.6% | 5.4% |
| Median | 12.3% | 4.8% |
| Interquartile 25% (IQ1) | 7.7% | 3.9% |
| Interquartile 75% (IQ3) | 30.3% | 5.5% |
| Interquartile Range (IQR) | 22.7% | 1.6% |
| Standard Deviation (Sample) | 28.7% | 3.1% |
| Standard Deviation (Population) | 28.0% | 3.1% |
Demographics Similar to Immigrants from Germany and Burmese by Unemployment Among Seniors over 65 years
In terms of unemployment among seniors over 65 years, the demographic groups most similar to Immigrants from Germany are Immigrants from Vietnam (5.0%, a difference of 0.030%), Immigrants from Malaysia (5.0%, a difference of 0.050%), Immigrants from Saudi Arabia (5.0%, a difference of 0.060%), Immigrants from Turkey (5.0%, a difference of 0.16%), and Okinawan (5.0%, a difference of 0.22%). Similarly, the demographic groups most similar to Burmese are Assyrian/Chaldean/Syriac (5.0%, a difference of 0.010%), Immigrants from Singapore (5.0%, a difference of 0.020%), Immigrants from Oceania (5.0%, a difference of 0.020%), Czechoslovakian (5.0%, a difference of 0.030%), and South African (5.0%, a difference of 0.080%).
| Demographics | Rating | Rank | Unemployment Among Seniors over 65 years |
| Immigrants | South Africa | 97.6 /100 | #90 | Exceptional 5.0% |
| Immigrants | Bolivia | 97.3 /100 | #91 | Exceptional 5.0% |
| Immigrants | Bulgaria | 97.3 /100 | #92 | Exceptional 5.0% |
| Austrians | 97.3 /100 | #93 | Exceptional 5.0% |
| Burmese | 96.8 /100 | #94 | Exceptional 5.0% |
| Assyrians/Chaldeans/Syriacs | 96.8 /100 | #95 | Exceptional 5.0% |
| Immigrants | Singapore | 96.8 /100 | #96 | Exceptional 5.0% |
| Immigrants | Oceania | 96.8 /100 | #97 | Exceptional 5.0% |
| Czechoslovakians | 96.7 /100 | #98 | Exceptional 5.0% |
| South Africans | 96.5 /100 | #99 | Exceptional 5.0% |
| Romanians | 95.5 /100 | #100 | Exceptional 5.0% |
| Yugoslavians | 95.4 /100 | #101 | Exceptional 5.0% |
| Immigrants | Thailand | 95.4 /100 | #102 | Exceptional 5.0% |
| Immigrants | Lithuania | 95.1 /100 | #103 | Exceptional 5.0% |
| Immigrants | Scotland | 95.0 /100 | #104 | Exceptional 5.0% |
| Okinawans | 94.7 /100 | #105 | Exceptional 5.0% |
| Immigrants | Turkey | 94.3 /100 | #106 | Exceptional 5.0% |
| Immigrants | Germany | 93.2 /100 | #107 | Exceptional 5.0% |
| Immigrants | Vietnam | 92.9 /100 | #108 | Exceptional 5.0% |
| Immigrants | Malaysia | 92.7 /100 | #109 | Exceptional 5.0% |
| Immigrants | Saudi Arabia | 92.7 /100 | #110 | Exceptional 5.0% |