Pueblo vs Immigrants from Belgium Female Unemployment

COMPARE

Pueblo
Race
Ancestry
AfghanAfricanAlaska NativeAlaskan AthabascanAlbanianAleutAlsatianAmericanApacheArabArapahoArgentineanArmenianAssyrian/Chaldean/SyriacAustralianAustrianBahamianBangladeshiBarbadianBasqueBelgianBelizeanBermudanBhutaneseBlackfeetBolivianBrazilianBritishBritish West IndianBulgarianBurmeseCajunCambodianCanadianCape VerdeanCarpatho RusynCelticCentral AmericanCentral American IndianCherokeeCheyenneChickasawChileanChineseChippewaChoctawColombianColvilleComancheCosta RicanCreeCreekCroatianCrowCubanCypriotCzechCzechoslovakianDanishDelawareDominicanDutchDutch West IndianEastern EuropeanEcuadorianEgyptianEnglishEstonianEthiopianEuropeanFijianFilipinoFinnishFrenchFrench American IndianFrench CanadianGermanGerman RussianGhanaianGreekGuamanian/ChamorroGuatemalanGuyaneseHaitianHmongHonduranHopiHoumaHungarianIcelanderIndian (Asian)IndonesianInupiatIranianIraqiIrishIroquoisIsraeliItalianJamaicanJapaneseJordanianKenyanKiowaKoreanLaotianLatvianLebaneseLiberianLithuanianLumbeeLuxembourgerMacedonianMalaysianMalteseMarshalleseMenomineeMexicanMexican American IndianMongolianMoroccanNative HawaiianNavajoNepaleseNew ZealanderNicaraguanNigerianNorthern EuropeanNorwegianOkinawanOsageOttawaPaiutePakistaniPalestinianPanamanianParaguayanPennsylvania GermanPeruvianPimaPolishPortuguesePotawatomiPuebloPuerto RicanPuget Sound SalishRomanianRussianSalvadoranSamoanScandinavianScotch-IrishScottishSeminoleSenegaleseSerbianShoshoneSierra LeoneanSiouxSlavicSlovakSloveneSomaliSouth AfricanSouth AmericanSouth American IndianSoviet UnionSpaniardSpanishSpanish AmericanSpanish American IndianSri LankanSubsaharan AfricanSudaneseSwedishSwissSyrianTaiwaneseThaiTlingit-HaidaTohono O'OdhamTonganTrinidadian and TobagonianTsimshianTurkishU.S. Virgin IslanderUgandanUkrainianUruguayanUteVenezuelanVietnameseWelshWest IndianYakamaYaquiYugoslavianYumanYup'ikZimbabwean
Immigration
NonimmigrantsImmigrantsAfghanistanAfricaAlbaniaArgentinaArmeniaAsiaAustraliaAustriaBahamasBangladeshBarbadosBelarusBelizeBoliviaBosnia and HerzegovinaBrazilBulgariaBurma/MyanmarCabo VerdeCambodiaCameroonCanadaCaribbeanCentral AmericaChileChinaColombiaCongoCosta RicaCroatiaCubaCzechoslovakiaDenmarkDominicaDominican RepublicEastern AfricaEastern AsiaEastern EuropeEcuadorEgyptEl SalvadorEnglandEritreaEthiopiaEuropeFijiFranceGermanyGhanaGreeceGrenadaGuatemalaGuyanaHaitiHondurasHong KongHungaryIndiaIndonesiaIranIraqIrelandIsraelItalyJamaicaJapanJordanKazakhstanKenyaKoreaKuwaitLaosLatin AmericaLatviaLebanonLiberiaLithuaniaMalaysiaMexicoMicronesiaMiddle AfricaMoldovaMoroccoNepalNetherlandsNicaraguaNigeriaNorth AmericaNorth MacedoniaNorthern AfricaNorthern EuropeNorwayOceaniaPakistanPanamaPeruPhilippinesPolandPortugalRomaniaRussiaSaudi ArabiaScotlandSenegalSerbiaSierra LeoneSingaporeSomaliaSouth AfricaSouth AmericaSouth Central AsiaSouth Eastern AsiaSouthern EuropeSpainSri LankaSt. Vincent and the GrenadinesSudanSwedenSwitzerlandSyriaTaiwanThailandTrinidad and TobagoTurkeyUgandaUkraineUruguayUzbekistanVenezuelaVietnamWest IndiesWestern AfricaWestern AsiaWestern EuropeYemenZaireZimbabweAzores
Immigrants from Belgium
Race
Ancestry
AfghanAfricanAlaska NativeAlaskan AthabascanAlbanianAleutAlsatianAmericanApacheArabArapahoArgentineanArmenianAssyrian/Chaldean/SyriacAustralianAustrianBahamianBangladeshiBarbadianBasqueBelgianBelizeanBermudanBhutaneseBlackfeetBolivianBrazilianBritishBritish West IndianBulgarianBurmeseCajunCambodianCanadianCape VerdeanCarpatho RusynCelticCentral AmericanCentral American IndianCherokeeCheyenneChickasawChileanChineseChippewaChoctawColombianColvilleComancheCosta RicanCreeCreekCroatianCrowCubanCypriotCzechCzechoslovakianDanishDelawareDominicanDutchDutch West IndianEastern EuropeanEcuadorianEgyptianEnglishEstonianEthiopianEuropeanFijianFilipinoFinnishFrenchFrench American IndianFrench CanadianGermanGerman RussianGhanaianGreekGuamanian/ChamorroGuatemalanGuyaneseHaitianHmongHonduranHopiHoumaHungarianIcelanderIndian (Asian)IndonesianInupiatIranianIraqiIrishIroquoisIsraeliItalianJamaicanJapaneseJordanianKenyanKiowaKoreanLaotianLatvianLebaneseLiberianLithuanianLumbeeLuxembourgerMacedonianMalaysianMalteseMarshalleseMenomineeMexicanMexican American IndianMongolianMoroccanNative HawaiianNavajoNepaleseNew ZealanderNicaraguanNigerianNorthern EuropeanNorwegianOkinawanOsageOttawaPaiutePakistaniPalestinianPanamanianParaguayanPennsylvania GermanPeruvianPimaPolishPortuguesePotawatomiPuerto RicanPuget Sound SalishRomanianRussianSalvadoranSamoanScandinavianScotch-IrishScottishSeminoleSenegaleseSerbianShoshoneSierra LeoneanSiouxSlavicSlovakSloveneSomaliSouth AfricanSouth AmericanSouth American IndianSoviet UnionSpaniardSpanishSpanish AmericanSpanish American IndianSri LankanSubsaharan AfricanSudaneseSwedishSwissSyrianTaiwaneseThaiTlingit-HaidaTohono O'OdhamTonganTrinidadian and TobagonianTsimshianTurkishU.S. Virgin IslanderUgandanUkrainianUruguayanUteVenezuelanVietnameseWelshWest IndianYakamaYaquiYugoslavianYumanYup'ikZimbabwean
Immigration
NonimmigrantsImmigrantsAfghanistanAfricaAlbaniaArgentinaArmeniaAsiaAustraliaAustriaBahamasBangladeshBarbadosBelarusBelgiumBelizeBoliviaBosnia and HerzegovinaBrazilBulgariaBurma/MyanmarCabo VerdeCambodiaCameroonCanadaCaribbeanCentral AmericaChileChinaColombiaCongoCosta RicaCroatiaCubaCzechoslovakiaDenmarkDominicaDominican RepublicEastern AfricaEastern AsiaEastern EuropeEcuadorEgyptEl SalvadorEnglandEritreaEthiopiaEuropeFijiFranceGermanyGhanaGreeceGrenadaGuatemalaGuyanaHaitiHondurasHong KongHungaryIndiaIndonesiaIranIraqIrelandIsraelItalyJamaicaJapanJordanKazakhstanKenyaKoreaKuwaitLaosLatin AmericaLatviaLebanonLiberiaLithuaniaMalaysiaMexicoMicronesiaMiddle AfricaMoldovaMoroccoNepalNetherlandsNicaraguaNigeriaNorth AmericaNorth MacedoniaNorthern AfricaNorthern EuropeNorwayOceaniaPakistanPanamaPeruPhilippinesPolandPortugalRomaniaRussiaSaudi ArabiaScotlandSenegalSerbiaSierra LeoneSingaporeSomaliaSouth AfricaSouth AmericaSouth Central AsiaSouth Eastern AsiaSouthern EuropeSpainSri LankaSt. Vincent and the GrenadinesSudanSwedenSwitzerlandSyriaTaiwanThailandTrinidad and TobagoTurkeyUgandaUkraineUruguayUzbekistanVenezuelaVietnamWest IndiesWestern AfricaWestern AsiaWestern EuropeYemenZaireZimbabweAzores
Female Unemployment
Income
Poverty
Unemployment
Labor Participation
Family Structure
Vehicle Availability
Education Level
Disability

Female Unemployment Comparison

Pueblo

Immigrants from Belgium

Tragic
Exceptional
6.4%
FEMALE UNEMPLOYMENT
0.0/ 100
METRIC RATING
315th/ 347
METRIC RANK
4.9%
FEMALE UNEMPLOYMENT
98.5/ 100
METRIC RATING
63rd/ 347
METRIC RANK

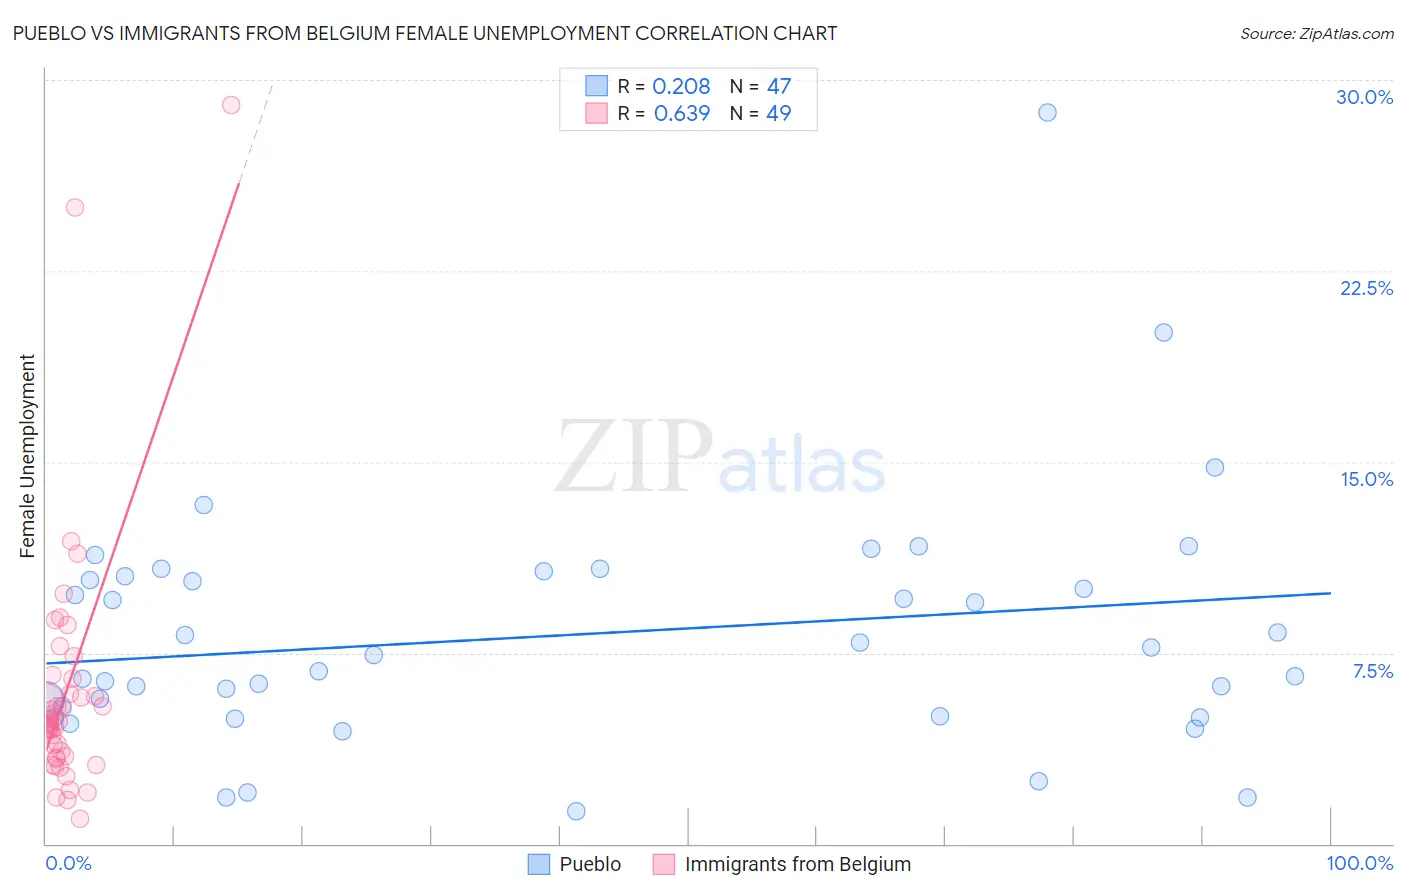
Pueblo vs Immigrants from Belgium Female Unemployment Correlation Chart

The statistical analysis conducted on geographies consisting of 119,838,706 people shows a weak positive correlation between the proportion of Pueblo and unemploymnet rate among females in the United States with a correlation coefficient (R) of 0.208 and weighted average of 6.4%. Similarly, the statistical analysis conducted on geographies consisting of 146,408,368 people shows a significant positive correlation between the proportion of Immigrants from Belgium and unemploymnet rate among females in the United States with a correlation coefficient (R) of 0.639 and weighted average of 4.9%, a difference of 29.4%.
Pueblo vs Immigrants from Belgium Female Unemployment

Female Unemployment Correlation Summary

MeasurementPuebloImmigrants from Belgium
Minimum1.3%1.0%
Maximum28.7%29.0%
Range27.4%28.0%
Mean8.2%5.9%
Median7.4%4.7%
Interquartile 25% (IQ1)5.0%3.4%
Interquartile 75% (IQ3)10.5%6.2%
Interquartile Range (IQR)5.5%2.8%
Standard Deviation (Sample)4.8%5.0%
Standard Deviation (Population)4.7%4.9%

Similar Demographics by Female Unemployment

Demographics Similar to Pueblo by Female Unemployment

In terms of female unemployment, the demographic groups most similar to Pueblo are Houma (6.4%, a difference of 0.29%), Immigrants from Ecuador (6.4%, a difference of 0.31%), Belizean (6.3%, a difference of 0.54%), Immigrants from Grenada (6.3%, a difference of 0.55%), and Immigrants from St. Vincent and the Grenadines (6.4%, a difference of 0.74%).
DemographicsRating | RankFemale Unemployment
Hispanics or Latinos
0.0
/100
|
#308
Tragic
6.2%
Ecuadorians
0.0
/100
|
#309
Tragic
6.3%
Central American Indians
0.0
/100
|
#310
Tragic
6.3%
Immigrants | Mexico
0.0
/100
|
#311
Tragic
6.3%
Immigrants | Grenada
0.0
/100
|
#312
Tragic
6.3%
Belizeans
0.0
/100
|
#313
Tragic
6.3%
Immigrants | Ecuador
0.0
/100
|
#314
Tragic
6.4%
Pueblo
0.0
/100
|
#315
Tragic
6.4%
Houma
0.0
/100
|
#316
Tragic
6.4%
Immigrants | St. Vincent and the Grenadines
0.0
/100
|
#317
Tragic
6.4%
British West Indians
0.0
/100
|
#318
Tragic
6.4%
Immigrants | Bangladesh
0.0
/100
|
#319
Tragic
6.5%
Immigrants | Dominica
0.0
/100
|
#320
Tragic
6.5%
Blacks/African Americans
0.0
/100
|
#321
Tragic
6.5%
Vietnamese
0.0
/100
|
#322
Tragic
6.5%

Demographics Similar to Immigrants from Belgium by Female Unemployment

In terms of female unemployment, the demographic groups most similar to Immigrants from Belgium are Celtic (4.9%, a difference of 0.0%), Immigrants from Nepal (4.9%, a difference of 0.11%), Immigrants from Scotland (4.9%, a difference of 0.12%), Immigrants from Canada (4.9%, a difference of 0.12%), and Immigrants from North America (4.9%, a difference of 0.19%).
DemographicsRating | RankFemale Unemployment
Serbians
99.0
/100
|
#56
Exceptional
4.9%
Icelanders
98.8
/100
|
#57
Exceptional
4.9%
Immigrants | Lithuania
98.8
/100
|
#58
Exceptional
4.9%
Bhutanese
98.7
/100
|
#59
Exceptional
4.9%
Immigrants | Scotland
98.6
/100
|
#60
Exceptional
4.9%
Immigrants | Canada
98.6
/100
|
#61
Exceptional
4.9%
Immigrants | Nepal
98.6
/100
|
#62
Exceptional
4.9%
Immigrants | Belgium
98.5
/100
|
#63
Exceptional
4.9%
Celtics
98.5
/100
|
#64
Exceptional
4.9%
Immigrants | North America
98.3
/100
|
#65
Exceptional
4.9%
Hungarians
98.3
/100
|
#66
Exceptional
4.9%
Cubans
98.3
/100
|
#67
Exceptional
4.9%
Tlingit-Haida
98.3
/100
|
#68
Exceptional
4.9%
Immigrants | Ireland
98.2
/100
|
#69
Exceptional
4.9%
Osage
98.2
/100
|
#70
Exceptional
4.9%