Portuguese vs Scandinavian Male Unemployment
COMPARE
Portuguese
Scandinavian
Male Unemployment
Male Unemployment Comparison
Portuguese
Scandinavians
5.6%
MALE UNEMPLOYMENT
3.5/ 100
METRIC RATING
220th/ 347
METRIC RANK
4.7%
MALE UNEMPLOYMENT
100.0/ 100
METRIC RATING
15th/ 347
METRIC RANK
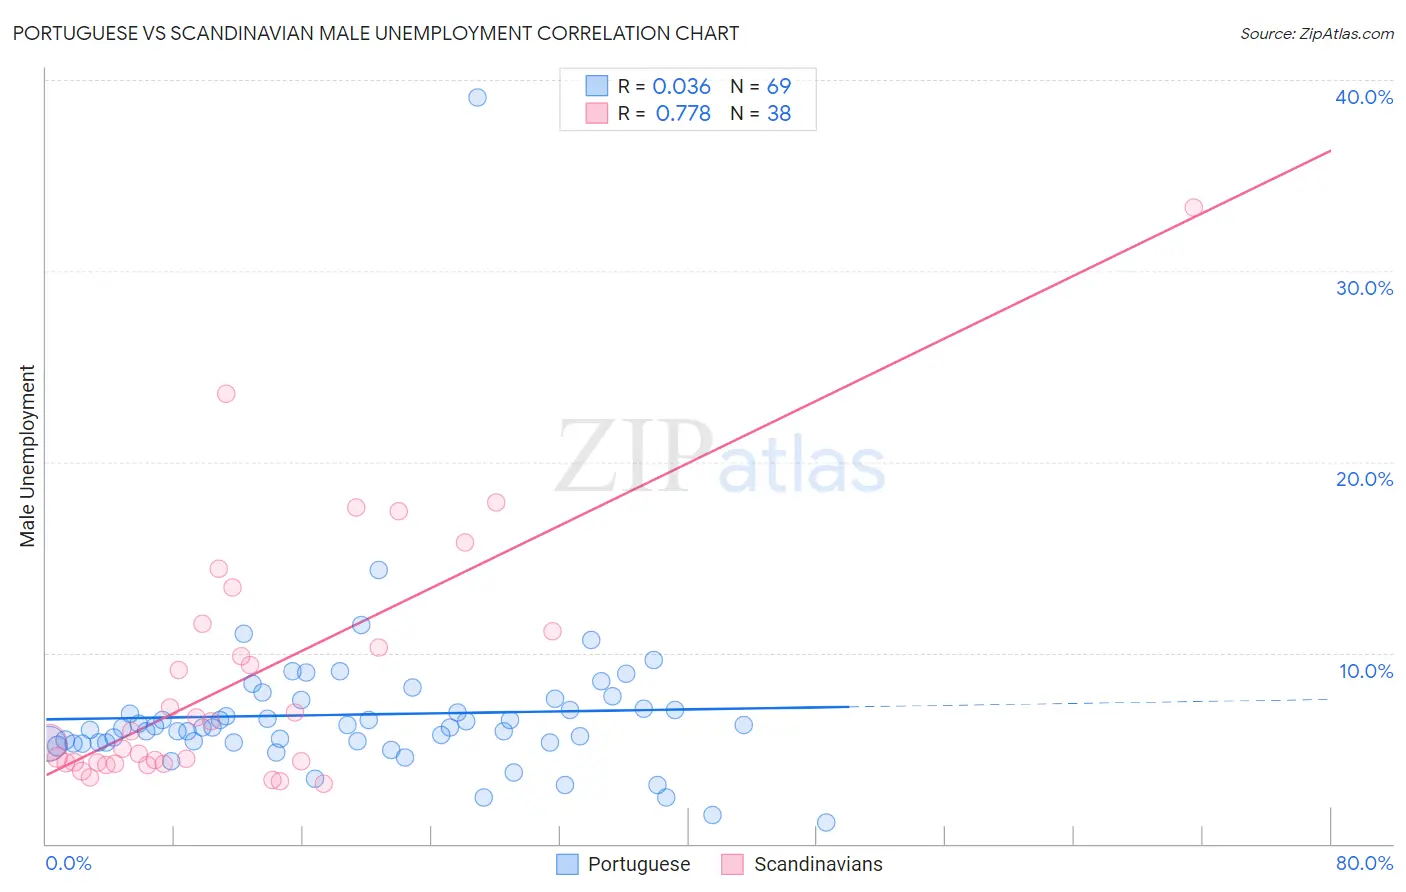
Portuguese vs Scandinavian Male Unemployment Correlation Chart
The statistical analysis conducted on geographies consisting of 447,471,773 people shows no correlation between the proportion of Portuguese and unemployment rate among males in the United States with a correlation coefficient (R) of 0.036 and weighted average of 5.6%. Similarly, the statistical analysis conducted on geographies consisting of 467,906,734 people shows a strong positive correlation between the proportion of Scandinavians and unemployment rate among males in the United States with a correlation coefficient (R) of 0.778 and weighted average of 4.7%, a difference of 18.0%.
Male Unemployment Correlation Summary
| Measurement | Portuguese | Scandinavian |
| Minimum | 1.1% | 3.1% |
| Maximum | 39.1% | 33.3% |
| Range | 38.0% | 30.2% |
| Mean | 6.8% | 8.6% |
| Median | 6.1% | 5.6% |
| Interquartile 25% (IQ1) | 5.3% | 4.2% |
| Interquartile 75% (IQ3) | 7.3% | 11.1% |
| Interquartile Range (IQR) | 2.0% | 6.9% |
| Standard Deviation (Sample) | 4.5% | 6.6% |
| Standard Deviation (Population) | 4.5% | 6.5% |
Similar Demographics by Male Unemployment
Demographics Similar to Portuguese by Male Unemployment
In terms of male unemployment, the demographic groups most similar to Portuguese are Immigrants from Western Asia (5.6%, a difference of 0.030%), Immigrants from Albania (5.5%, a difference of 0.070%), Soviet Union (5.6%, a difference of 0.11%), Immigrants from Micronesia (5.6%, a difference of 0.25%), and Delaware (5.5%, a difference of 0.28%).
| Demographics | Rating | Rank | Male Unemployment |
| Ugandans | 6.3 /100 | #213 | Tragic 5.5% |
| Puget Sound Salish | 5.6 /100 | #214 | Tragic 5.5% |
| Samoans | 4.9 /100 | #215 | Tragic 5.5% |
| Immigrants | Immigrants | 4.3 /100 | #216 | Tragic 5.5% |
| Delaware | 4.2 /100 | #217 | Tragic 5.5% |
| Immigrants | Albania | 3.6 /100 | #218 | Tragic 5.5% |
| Immigrants | Western Asia | 3.5 /100 | #219 | Tragic 5.6% |
| Portuguese | 3.5 /100 | #220 | Tragic 5.6% |
| Soviet Union | 3.2 /100 | #221 | Tragic 5.6% |
| Immigrants | Micronesia | 2.9 /100 | #222 | Tragic 5.6% |
| Creek | 2.6 /100 | #223 | Tragic 5.6% |
| Cherokee | 2.4 /100 | #224 | Tragic 5.6% |
| Panamanians | 1.9 /100 | #225 | Tragic 5.6% |
| Immigrants | Cambodia | 1.8 /100 | #226 | Tragic 5.6% |
| Immigrants | Panama | 1.8 /100 | #227 | Tragic 5.6% |
Demographics Similar to Scandinavians by Male Unemployment
In terms of male unemployment, the demographic groups most similar to Scandinavians are Swiss (4.7%, a difference of 0.050%), German (4.7%, a difference of 0.27%), Bolivian (4.7%, a difference of 0.29%), Filipino (4.7%, a difference of 0.78%), and Immigrants from Bolivia (4.7%, a difference of 0.97%).
| Demographics | Rating | Rank | Male Unemployment |
| Luxembourgers | 100.0 /100 | #8 | Exceptional 4.5% |
| Thais | 100.0 /100 | #9 | Exceptional 4.6% |
| Cubans | 100.0 /100 | #10 | Exceptional 4.6% |
| Swedes | 100.0 /100 | #11 | Exceptional 4.6% |
| Immigrants | Bolivia | 100.0 /100 | #12 | Exceptional 4.7% |
| Bolivians | 100.0 /100 | #13 | Exceptional 4.7% |
| Germans | 100.0 /100 | #14 | Exceptional 4.7% |
| Scandinavians | 100.0 /100 | #15 | Exceptional 4.7% |
| Swiss | 99.9 /100 | #16 | Exceptional 4.7% |
| Filipinos | 99.9 /100 | #17 | Exceptional 4.7% |
| English | 99.9 /100 | #18 | Exceptional 4.8% |
| Europeans | 99.9 /100 | #19 | Exceptional 4.8% |
| Pennsylvania Germans | 99.9 /100 | #20 | Exceptional 4.8% |
| Immigrants | Taiwan | 99.9 /100 | #21 | Exceptional 4.8% |
| Carpatho Rusyns | 99.9 /100 | #22 | Exceptional 4.8% |