Portuguese vs Pueblo Male Unemployment
COMPARE
Portuguese
Pueblo
Male Unemployment
Male Unemployment Comparison
Portuguese
Pueblo
5.6%
MALE UNEMPLOYMENT
3.5/ 100
METRIC RATING
220th/ 347
METRIC RANK
8.5%
MALE UNEMPLOYMENT
0.0/ 100
METRIC RATING
335th/ 347
METRIC RANK
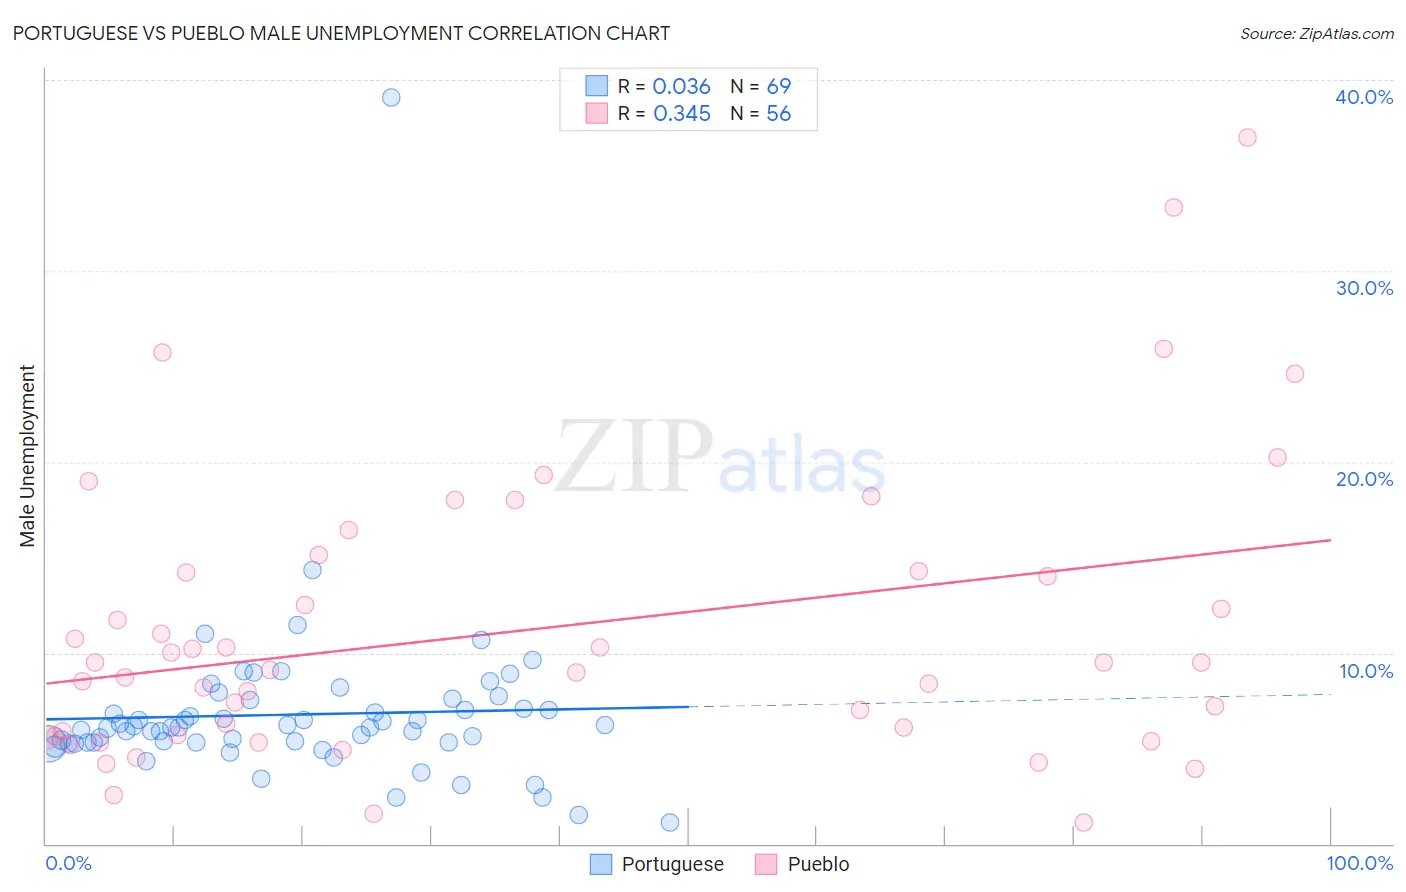
Portuguese vs Pueblo Male Unemployment Correlation Chart
The statistical analysis conducted on geographies consisting of 447,471,773 people shows no correlation between the proportion of Portuguese and unemployment rate among males in the United States with a correlation coefficient (R) of 0.036 and weighted average of 5.6%. Similarly, the statistical analysis conducted on geographies consisting of 119,915,032 people shows a mild positive correlation between the proportion of Pueblo and unemployment rate among males in the United States with a correlation coefficient (R) of 0.345 and weighted average of 8.5%, a difference of 52.5%.
Male Unemployment Correlation Summary
| Measurement | Portuguese | Pueblo |
| Minimum | 1.1% | 1.1% |
| Maximum | 39.1% | 37.0% |
| Range | 38.0% | 35.9% |
| Mean | 6.8% | 11.2% |
| Median | 6.1% | 9.3% |
| Interquartile 25% (IQ1) | 5.3% | 5.7% |
| Interquartile 75% (IQ3) | 7.3% | 14.3% |
| Interquartile Range (IQR) | 2.0% | 8.6% |
| Standard Deviation (Sample) | 4.5% | 7.5% |
| Standard Deviation (Population) | 4.5% | 7.4% |
Similar Demographics by Male Unemployment
Demographics Similar to Portuguese by Male Unemployment
In terms of male unemployment, the demographic groups most similar to Portuguese are Immigrants from Western Asia (5.6%, a difference of 0.030%), Immigrants from Albania (5.5%, a difference of 0.070%), Soviet Union (5.6%, a difference of 0.11%), Immigrants from Micronesia (5.6%, a difference of 0.25%), and Delaware (5.5%, a difference of 0.28%).
| Demographics | Rating | Rank | Male Unemployment |
| Ugandans | 6.3 /100 | #213 | Tragic 5.5% |
| Puget Sound Salish | 5.6 /100 | #214 | Tragic 5.5% |
| Samoans | 4.9 /100 | #215 | Tragic 5.5% |
| Immigrants | Immigrants | 4.3 /100 | #216 | Tragic 5.5% |
| Delaware | 4.2 /100 | #217 | Tragic 5.5% |
| Immigrants | Albania | 3.6 /100 | #218 | Tragic 5.5% |
| Immigrants | Western Asia | 3.5 /100 | #219 | Tragic 5.6% |
| Portuguese | 3.5 /100 | #220 | Tragic 5.6% |
| Soviet Union | 3.2 /100 | #221 | Tragic 5.6% |
| Immigrants | Micronesia | 2.9 /100 | #222 | Tragic 5.6% |
| Creek | 2.6 /100 | #223 | Tragic 5.6% |
| Cherokee | 2.4 /100 | #224 | Tragic 5.6% |
| Panamanians | 1.9 /100 | #225 | Tragic 5.6% |
| Immigrants | Cambodia | 1.8 /100 | #226 | Tragic 5.6% |
| Immigrants | Panama | 1.8 /100 | #227 | Tragic 5.6% |
Demographics Similar to Pueblo by Male Unemployment
In terms of male unemployment, the demographic groups most similar to Pueblo are Tsimshian (8.5%, a difference of 0.060%), Sioux (8.4%, a difference of 1.0%), Yuman (8.6%, a difference of 1.4%), Puerto Rican (8.6%, a difference of 1.4%), and Apache (8.6%, a difference of 1.6%).
| Demographics | Rating | Rank | Male Unemployment |
| Natives/Alaskans | 0.0 /100 | #328 | Tragic 7.7% |
| Immigrants | Yemen | 0.0 /100 | #329 | Tragic 7.8% |
| Yakama | 0.0 /100 | #330 | Tragic 7.9% |
| Alaska Natives | 0.0 /100 | #331 | Tragic 8.1% |
| Pima | 0.0 /100 | #332 | Tragic 8.3% |
| Sioux | 0.0 /100 | #333 | Tragic 8.4% |
| Tsimshian | 0.0 /100 | #334 | Tragic 8.5% |
| Pueblo | 0.0 /100 | #335 | Tragic 8.5% |
| Yuman | 0.0 /100 | #336 | Tragic 8.6% |
| Puerto Ricans | 0.0 /100 | #337 | Tragic 8.6% |
| Apache | 0.0 /100 | #338 | Tragic 8.6% |
| Cheyenne | 0.0 /100 | #339 | Tragic 9.8% |
| Alaskan Athabascans | 0.0 /100 | #340 | Tragic 9.8% |
| Navajo | 0.0 /100 | #341 | Tragic 9.8% |
| Tohono O'odham | 0.0 /100 | #342 | Tragic 10.2% |