Portuguese vs Pima Male Unemployment
COMPARE
Portuguese
Pima
Male Unemployment
Male Unemployment Comparison
Portuguese
Pima
5.6%
MALE UNEMPLOYMENT
3.5/ 100
METRIC RATING
220th/ 347
METRIC RANK
8.3%
MALE UNEMPLOYMENT
0.0/ 100
METRIC RATING
332nd/ 347
METRIC RANK
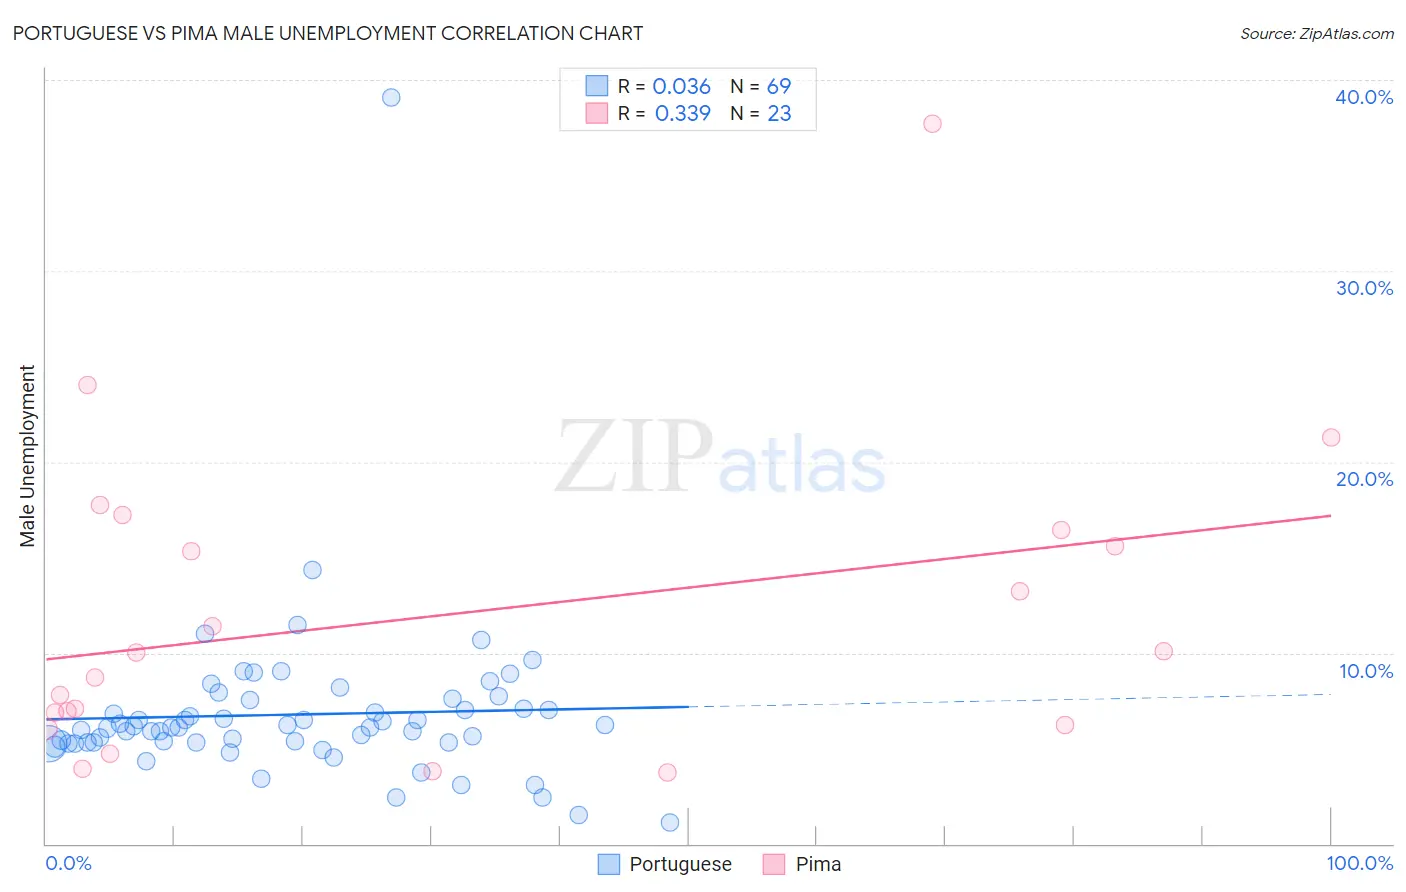
Portuguese vs Pima Male Unemployment Correlation Chart
The statistical analysis conducted on geographies consisting of 447,471,773 people shows no correlation between the proportion of Portuguese and unemployment rate among males in the United States with a correlation coefficient (R) of 0.036 and weighted average of 5.6%. Similarly, the statistical analysis conducted on geographies consisting of 61,468,646 people shows a mild positive correlation between the proportion of Pima and unemployment rate among males in the United States with a correlation coefficient (R) of 0.339 and weighted average of 8.3%, a difference of 49.0%.
Male Unemployment Correlation Summary
| Measurement | Portuguese | Pima |
| Minimum | 1.1% | 3.7% |
| Maximum | 39.1% | 37.7% |
| Range | 38.0% | 34.0% |
| Mean | 6.8% | 12.0% |
| Median | 6.1% | 10.0% |
| Interquartile 25% (IQ1) | 5.3% | 6.2% |
| Interquartile 75% (IQ3) | 7.3% | 16.4% |
| Interquartile Range (IQR) | 2.0% | 10.2% |
| Standard Deviation (Sample) | 4.5% | 8.1% |
| Standard Deviation (Population) | 4.5% | 7.9% |
Similar Demographics by Male Unemployment
Demographics Similar to Portuguese by Male Unemployment
In terms of male unemployment, the demographic groups most similar to Portuguese are Immigrants from Western Asia (5.6%, a difference of 0.030%), Immigrants from Albania (5.5%, a difference of 0.070%), Soviet Union (5.6%, a difference of 0.11%), Immigrants from Micronesia (5.6%, a difference of 0.25%), and Delaware (5.5%, a difference of 0.28%).
| Demographics | Rating | Rank | Male Unemployment |
| Ugandans | 6.3 /100 | #213 | Tragic 5.5% |
| Puget Sound Salish | 5.6 /100 | #214 | Tragic 5.5% |
| Samoans | 4.9 /100 | #215 | Tragic 5.5% |
| Immigrants | Immigrants | 4.3 /100 | #216 | Tragic 5.5% |
| Delaware | 4.2 /100 | #217 | Tragic 5.5% |
| Immigrants | Albania | 3.6 /100 | #218 | Tragic 5.5% |
| Immigrants | Western Asia | 3.5 /100 | #219 | Tragic 5.6% |
| Portuguese | 3.5 /100 | #220 | Tragic 5.6% |
| Soviet Union | 3.2 /100 | #221 | Tragic 5.6% |
| Immigrants | Micronesia | 2.9 /100 | #222 | Tragic 5.6% |
| Creek | 2.6 /100 | #223 | Tragic 5.6% |
| Cherokee | 2.4 /100 | #224 | Tragic 5.6% |
| Panamanians | 1.9 /100 | #225 | Tragic 5.6% |
| Immigrants | Cambodia | 1.8 /100 | #226 | Tragic 5.6% |
| Immigrants | Panama | 1.8 /100 | #227 | Tragic 5.6% |
Demographics Similar to Pima by Male Unemployment
In terms of male unemployment, the demographic groups most similar to Pima are Sioux (8.4%, a difference of 1.3%), Tsimshian (8.5%, a difference of 2.3%), Alaska Native (8.1%, a difference of 2.4%), Pueblo (8.5%, a difference of 2.4%), and Yuman (8.6%, a difference of 3.8%).
| Demographics | Rating | Rank | Male Unemployment |
| Shoshone | 0.0 /100 | #325 | Tragic 7.6% |
| Immigrants | Dominican Republic | 0.0 /100 | #326 | Tragic 7.6% |
| Paiute | 0.0 /100 | #327 | Tragic 7.7% |
| Natives/Alaskans | 0.0 /100 | #328 | Tragic 7.7% |
| Immigrants | Yemen | 0.0 /100 | #329 | Tragic 7.8% |
| Yakama | 0.0 /100 | #330 | Tragic 7.9% |
| Alaska Natives | 0.0 /100 | #331 | Tragic 8.1% |
| Pima | 0.0 /100 | #332 | Tragic 8.3% |
| Sioux | 0.0 /100 | #333 | Tragic 8.4% |
| Tsimshian | 0.0 /100 | #334 | Tragic 8.5% |
| Pueblo | 0.0 /100 | #335 | Tragic 8.5% |
| Yuman | 0.0 /100 | #336 | Tragic 8.6% |
| Puerto Ricans | 0.0 /100 | #337 | Tragic 8.6% |
| Apache | 0.0 /100 | #338 | Tragic 8.6% |
| Cheyenne | 0.0 /100 | #339 | Tragic 9.8% |