Pennsylvania German vs Immigrants from Syria Male Unemployment
COMPARE
Pennsylvania German
Immigrants from Syria
Male Unemployment
Male Unemployment Comparison
Pennsylvania Germans
Immigrants from Syria
4.8%
MALE UNEMPLOYMENT
99.9/ 100
METRIC RATING
20th/ 347
METRIC RANK
5.5%
MALE UNEMPLOYMENT
9.3/ 100
METRIC RATING
207th/ 347
METRIC RANK
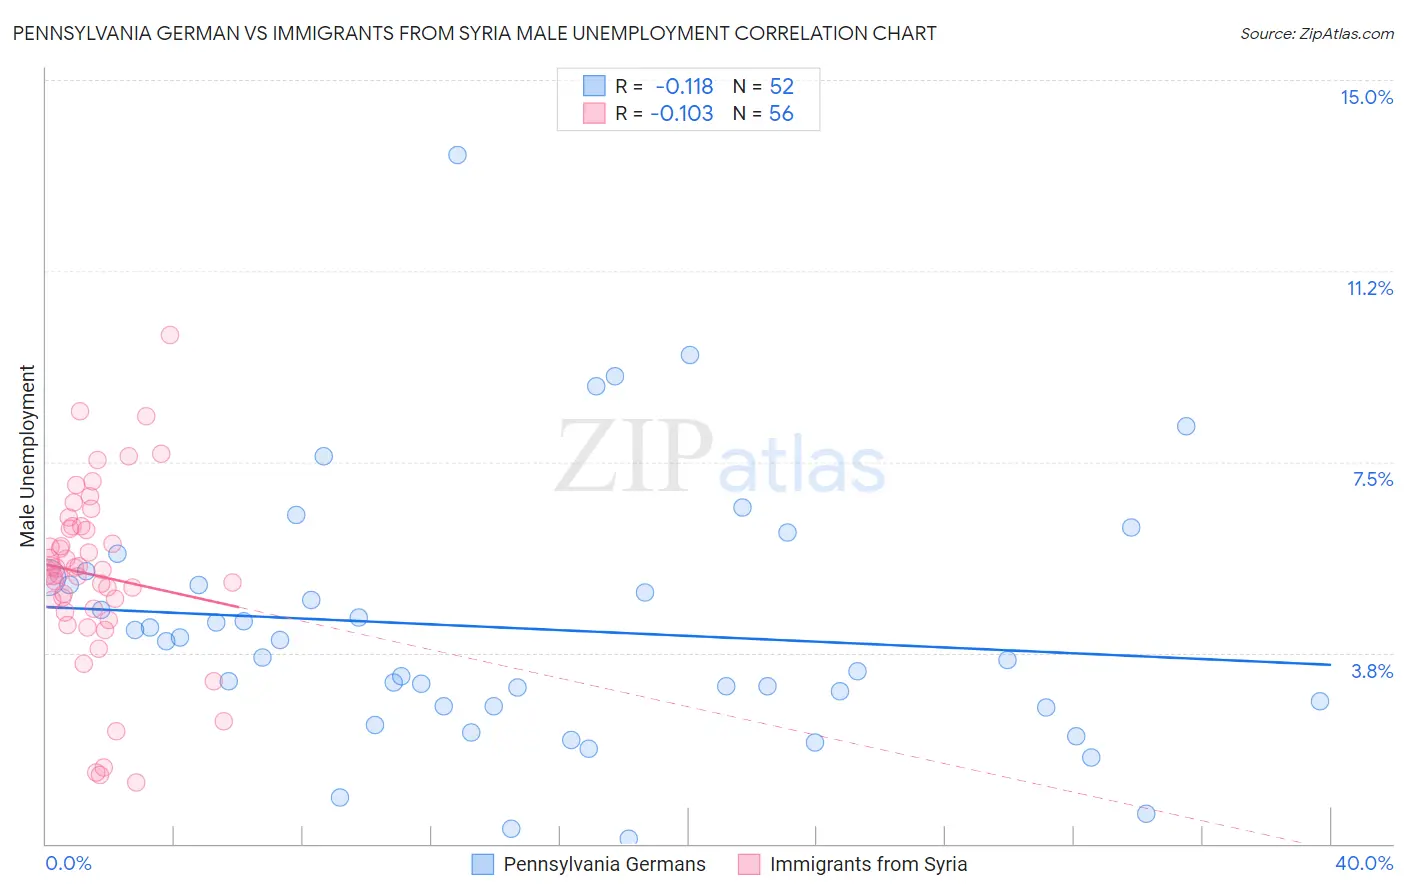
Pennsylvania German vs Immigrants from Syria Male Unemployment Correlation Chart
The statistical analysis conducted on geographies consisting of 232,803,431 people shows a poor negative correlation between the proportion of Pennsylvania Germans and unemployment rate among males in the United States with a correlation coefficient (R) of -0.118 and weighted average of 4.8%. Similarly, the statistical analysis conducted on geographies consisting of 173,829,424 people shows a poor negative correlation between the proportion of Immigrants from Syria and unemployment rate among males in the United States with a correlation coefficient (R) of -0.103 and weighted average of 5.5%, a difference of 14.9%.
Male Unemployment Correlation Summary
| Measurement | Pennsylvania German | Immigrants from Syria |
| Minimum | 0.10% | 1.2% |
| Maximum | 13.5% | 10.0% |
| Range | 13.4% | 8.8% |
| Mean | 4.2% | 5.3% |
| Median | 3.8% | 5.4% |
| Interquartile 25% (IQ1) | 2.7% | 4.6% |
| Interquartile 75% (IQ3) | 5.2% | 6.2% |
| Interquartile Range (IQR) | 2.5% | 1.6% |
| Standard Deviation (Sample) | 2.5% | 1.8% |
| Standard Deviation (Population) | 2.5% | 1.8% |
Similar Demographics by Male Unemployment
Demographics Similar to Pennsylvania Germans by Male Unemployment
In terms of male unemployment, the demographic groups most similar to Pennsylvania Germans are European (4.8%, a difference of 0.050%), English (4.8%, a difference of 0.080%), Immigrants from Taiwan (4.8%, a difference of 0.16%), Carpatho Rusyn (4.8%, a difference of 0.18%), and Tongan (4.8%, a difference of 0.22%).
| Demographics | Rating | Rank | Male Unemployment |
| Bolivians | 100.0 /100 | #13 | Exceptional 4.7% |
| Germans | 100.0 /100 | #14 | Exceptional 4.7% |
| Scandinavians | 100.0 /100 | #15 | Exceptional 4.7% |
| Swiss | 99.9 /100 | #16 | Exceptional 4.7% |
| Filipinos | 99.9 /100 | #17 | Exceptional 4.7% |
| English | 99.9 /100 | #18 | Exceptional 4.8% |
| Europeans | 99.9 /100 | #19 | Exceptional 4.8% |
| Pennsylvania Germans | 99.9 /100 | #20 | Exceptional 4.8% |
| Immigrants | Taiwan | 99.9 /100 | #21 | Exceptional 4.8% |
| Carpatho Rusyns | 99.9 /100 | #22 | Exceptional 4.8% |
| Tongans | 99.9 /100 | #23 | Exceptional 4.8% |
| Immigrants | South Central Asia | 99.9 /100 | #24 | Exceptional 4.8% |
| Zimbabweans | 99.9 /100 | #25 | Exceptional 4.8% |
| Dutch | 99.9 /100 | #26 | Exceptional 4.8% |
| Belgians | 99.9 /100 | #27 | Exceptional 4.8% |
Demographics Similar to Immigrants from Syria by Male Unemployment
In terms of male unemployment, the demographic groups most similar to Immigrants from Syria are Immigrants from Ukraine (5.5%, a difference of 0.10%), Immigrants from Lebanon (5.5%, a difference of 0.13%), Immigrants from Middle Africa (5.5%, a difference of 0.18%), South American Indian (5.5%, a difference of 0.31%), and Immigrants from Costa Rica (5.5%, a difference of 0.32%).
| Demographics | Rating | Rank | Male Unemployment |
| Immigrants | Zaire | 13.7 /100 | #200 | Poor 5.4% |
| Immigrants | Philippines | 13.5 /100 | #201 | Poor 5.4% |
| Immigrants | Nonimmigrants | 13.1 /100 | #202 | Poor 5.4% |
| Immigrants | Laos | 13.0 /100 | #203 | Poor 5.4% |
| Guamanians/Chamorros | 12.3 /100 | #204 | Poor 5.4% |
| Immigrants | Costa Rica | 11.4 /100 | #205 | Poor 5.5% |
| Immigrants | Ukraine | 9.9 /100 | #206 | Tragic 5.5% |
| Immigrants | Syria | 9.3 /100 | #207 | Tragic 5.5% |
| Immigrants | Lebanon | 8.6 /100 | #208 | Tragic 5.5% |
| Immigrants | Middle Africa | 8.3 /100 | #209 | Tragic 5.5% |
| South American Indians | 7.6 /100 | #210 | Tragic 5.5% |
| Israelis | 7.4 /100 | #211 | Tragic 5.5% |
| Hmong | 7.0 /100 | #212 | Tragic 5.5% |
| Ugandans | 6.3 /100 | #213 | Tragic 5.5% |
| Puget Sound Salish | 5.6 /100 | #214 | Tragic 5.5% |