Pennsylvania German vs Eastern European Male Unemployment
COMPARE
Pennsylvania German
Eastern European
Male Unemployment
Male Unemployment Comparison
Pennsylvania Germans
Eastern Europeans
4.8%
MALE UNEMPLOYMENT
99.9/ 100
METRIC RATING
20th/ 347
METRIC RANK
5.0%
MALE UNEMPLOYMENT
97.9/ 100
METRIC RATING
63rd/ 347
METRIC RANK
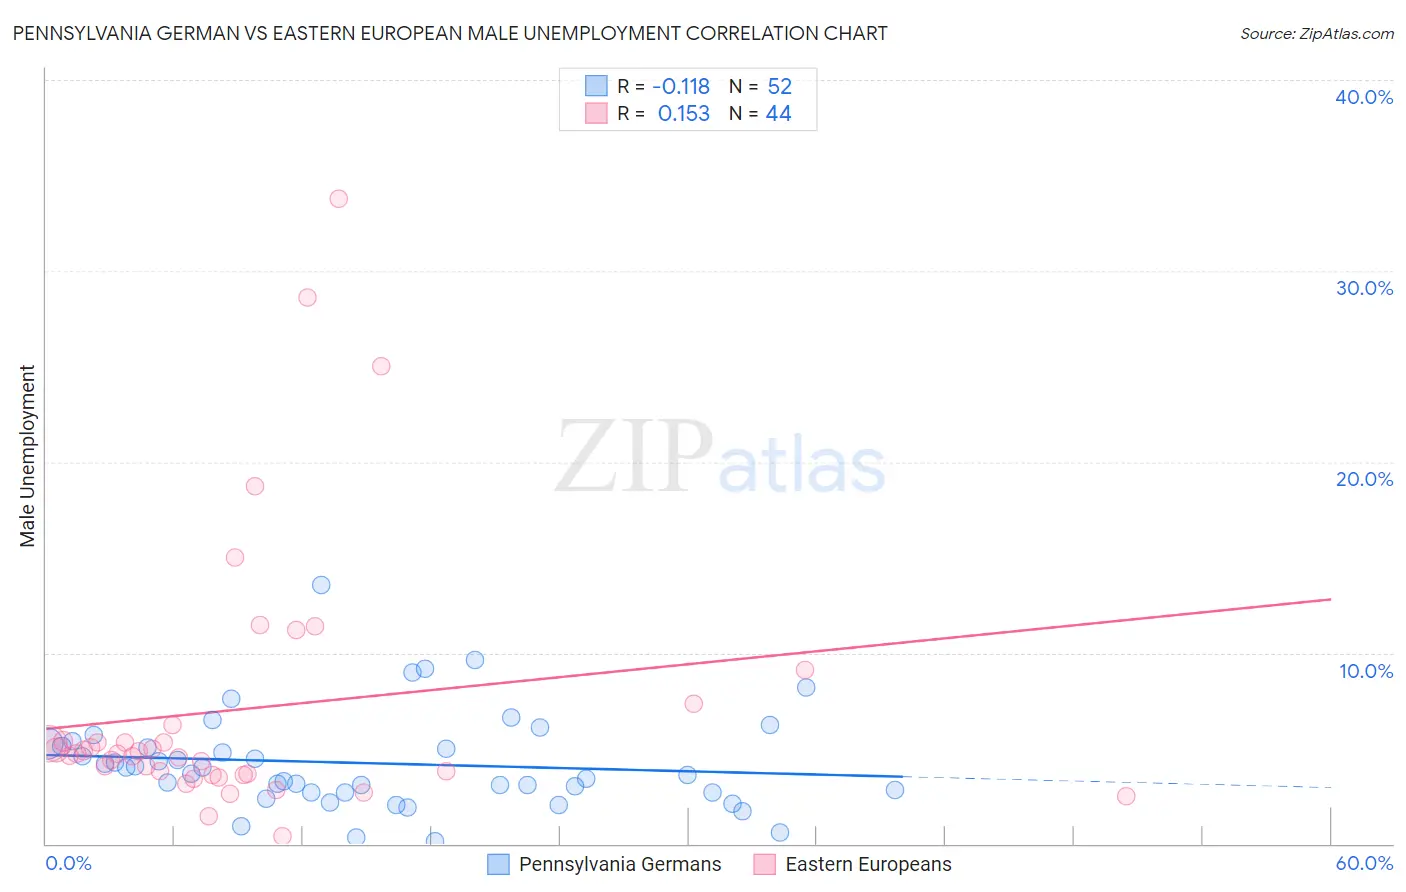
Pennsylvania German vs Eastern European Male Unemployment Correlation Chart
The statistical analysis conducted on geographies consisting of 232,803,431 people shows a poor negative correlation between the proportion of Pennsylvania Germans and unemployment rate among males in the United States with a correlation coefficient (R) of -0.118 and weighted average of 4.8%. Similarly, the statistical analysis conducted on geographies consisting of 457,878,512 people shows a poor positive correlation between the proportion of Eastern Europeans and unemployment rate among males in the United States with a correlation coefficient (R) of 0.153 and weighted average of 5.0%, a difference of 5.0%.
Male Unemployment Correlation Summary
| Measurement | Pennsylvania German | Eastern European |
| Minimum | 0.10% | 0.41% |
| Maximum | 13.5% | 33.8% |
| Range | 13.4% | 33.4% |
| Mean | 4.2% | 7.0% |
| Median | 3.8% | 4.7% |
| Interquartile 25% (IQ1) | 2.7% | 3.6% |
| Interquartile 75% (IQ3) | 5.2% | 5.8% |
| Interquartile Range (IQR) | 2.5% | 2.2% |
| Standard Deviation (Sample) | 2.5% | 7.0% |
| Standard Deviation (Population) | 2.5% | 6.9% |
Similar Demographics by Male Unemployment
Demographics Similar to Pennsylvania Germans by Male Unemployment
In terms of male unemployment, the demographic groups most similar to Pennsylvania Germans are European (4.8%, a difference of 0.050%), English (4.8%, a difference of 0.080%), Immigrants from Taiwan (4.8%, a difference of 0.16%), Carpatho Rusyn (4.8%, a difference of 0.18%), and Tongan (4.8%, a difference of 0.22%).
| Demographics | Rating | Rank | Male Unemployment |
| Bolivians | 100.0 /100 | #13 | Exceptional 4.7% |
| Germans | 100.0 /100 | #14 | Exceptional 4.7% |
| Scandinavians | 100.0 /100 | #15 | Exceptional 4.7% |
| Swiss | 99.9 /100 | #16 | Exceptional 4.7% |
| Filipinos | 99.9 /100 | #17 | Exceptional 4.7% |
| English | 99.9 /100 | #18 | Exceptional 4.8% |
| Europeans | 99.9 /100 | #19 | Exceptional 4.8% |
| Pennsylvania Germans | 99.9 /100 | #20 | Exceptional 4.8% |
| Immigrants | Taiwan | 99.9 /100 | #21 | Exceptional 4.8% |
| Carpatho Rusyns | 99.9 /100 | #22 | Exceptional 4.8% |
| Tongans | 99.9 /100 | #23 | Exceptional 4.8% |
| Immigrants | South Central Asia | 99.9 /100 | #24 | Exceptional 4.8% |
| Zimbabweans | 99.9 /100 | #25 | Exceptional 4.8% |
| Dutch | 99.9 /100 | #26 | Exceptional 4.8% |
| Belgians | 99.9 /100 | #27 | Exceptional 4.8% |
Demographics Similar to Eastern Europeans by Male Unemployment
In terms of male unemployment, the demographic groups most similar to Eastern Europeans are Basque (5.0%, a difference of 0.010%), Celtic (5.0%, a difference of 0.020%), Cambodian (5.0%, a difference of 0.14%), Icelander (5.0%, a difference of 0.18%), and Immigrants from Argentina (5.0%, a difference of 0.22%).
| Demographics | Rating | Rank | Male Unemployment |
| Immigrants | Bulgaria | 98.7 /100 | #56 | Exceptional 5.0% |
| Turks | 98.5 /100 | #57 | Exceptional 5.0% |
| Lithuanians | 98.5 /100 | #58 | Exceptional 5.0% |
| Immigrants | Netherlands | 98.3 /100 | #59 | Exceptional 5.0% |
| Immigrants | Argentina | 98.1 /100 | #60 | Exceptional 5.0% |
| Cambodians | 98.1 /100 | #61 | Exceptional 5.0% |
| Basques | 97.9 /100 | #62 | Exceptional 5.0% |
| Eastern Europeans | 97.9 /100 | #63 | Exceptional 5.0% |
| Celtics | 97.8 /100 | #64 | Exceptional 5.0% |
| Icelanders | 97.6 /100 | #65 | Exceptional 5.0% |
| Finns | 97.5 /100 | #66 | Exceptional 5.0% |
| Immigrants | Canada | 97.5 /100 | #67 | Exceptional 5.0% |
| Australians | 97.4 /100 | #68 | Exceptional 5.0% |
| Immigrants | Sweden | 97.4 /100 | #69 | Exceptional 5.0% |
| Whites/Caucasians | 97.3 /100 | #70 | Exceptional 5.0% |