Pennsylvania German vs Immigrants from Syria College, Under 1 year
COMPARE
Pennsylvania German
Immigrants from Syria
College, Under 1 year
College, Under 1 year Comparison
Pennsylvania Germans
Immigrants from Syria
54.5%
COLLEGE, UNDER 1 YEAR
0.0/ 100
METRIC RATING
336th/ 347
METRIC RANK
66.9%
COLLEGE, UNDER 1 YEAR
89.0/ 100
METRIC RATING
130th/ 347
METRIC RANK
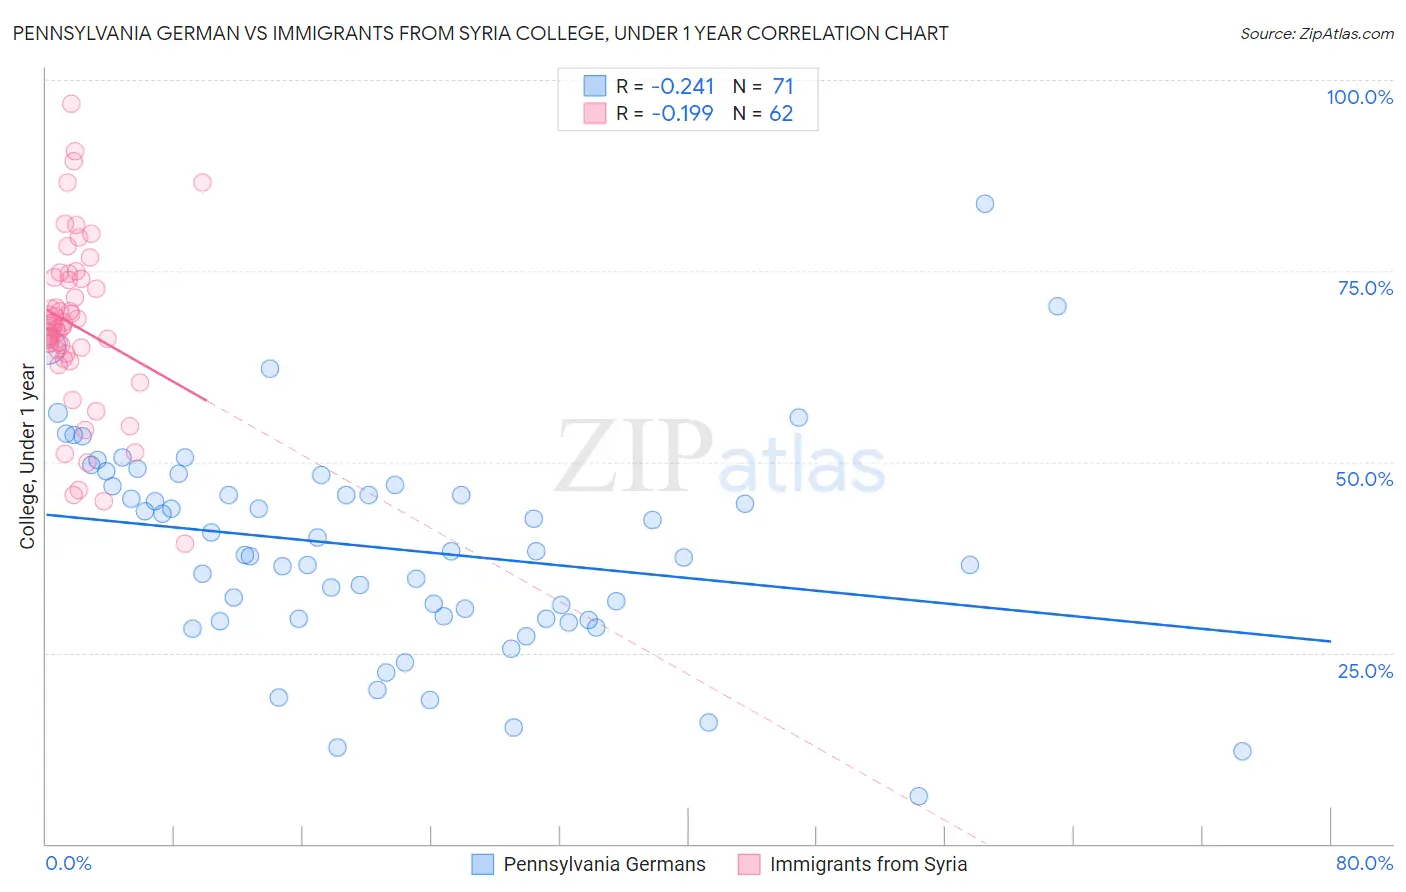
Pennsylvania German vs Immigrants from Syria College, Under 1 year Correlation Chart
The statistical analysis conducted on geographies consisting of 234,102,446 people shows a weak negative correlation between the proportion of Pennsylvania Germans and percentage of population with at least college, under 1 year education in the United States with a correlation coefficient (R) of -0.241 and weighted average of 54.5%. Similarly, the statistical analysis conducted on geographies consisting of 174,109,130 people shows a poor negative correlation between the proportion of Immigrants from Syria and percentage of population with at least college, under 1 year education in the United States with a correlation coefficient (R) of -0.199 and weighted average of 66.9%, a difference of 22.8%.
College, Under 1 year Correlation Summary
| Measurement | Pennsylvania German | Immigrants from Syria |
| Minimum | 6.2% | 39.2% |
| Maximum | 83.9% | 96.9% |
| Range | 77.6% | 57.7% |
| Mean | 38.7% | 67.8% |
| Median | 38.2% | 67.7% |
| Interquartile 25% (IQ1) | 29.4% | 64.1% |
| Interquartile 75% (IQ3) | 46.9% | 74.0% |
| Interquartile Range (IQR) | 17.5% | 9.9% |
| Standard Deviation (Sample) | 13.9% | 11.2% |
| Standard Deviation (Population) | 13.8% | 11.1% |
Similar Demographics by College, Under 1 year
Demographics Similar to Pennsylvania Germans by College, Under 1 year
In terms of college, under 1 year, the demographic groups most similar to Pennsylvania Germans are Immigrants from Central America (54.4%, a difference of 0.15%), Inupiat (54.6%, a difference of 0.17%), Immigrants from the Azores (54.7%, a difference of 0.30%), Lumbee (54.2%, a difference of 0.56%), and Immigrants from Dominican Republic (54.0%, a difference of 0.96%).
| Demographics | Rating | Rank | College, Under 1 year |
| Immigrants | Cuba | 0.0 /100 | #329 | Tragic 55.7% |
| Mexicans | 0.0 /100 | #330 | Tragic 55.6% |
| Dominicans | 0.0 /100 | #331 | Tragic 55.5% |
| Immigrants | Yemen | 0.0 /100 | #332 | Tragic 55.3% |
| Yuman | 0.0 /100 | #333 | Tragic 55.1% |
| Immigrants | Azores | 0.0 /100 | #334 | Tragic 54.7% |
| Inupiat | 0.0 /100 | #335 | Tragic 54.6% |
| Pennsylvania Germans | 0.0 /100 | #336 | Tragic 54.5% |
| Immigrants | Central America | 0.0 /100 | #337 | Tragic 54.4% |
| Lumbee | 0.0 /100 | #338 | Tragic 54.2% |
| Immigrants | Dominican Republic | 0.0 /100 | #339 | Tragic 54.0% |
| Spanish American Indians | 0.0 /100 | #340 | Tragic 54.0% |
| Immigrants | Cabo Verde | 0.0 /100 | #341 | Tragic 53.7% |
| Immigrants | Mexico | 0.0 /100 | #342 | Tragic 53.7% |
| Tohono O'odham | 0.0 /100 | #343 | Tragic 52.8% |
Demographics Similar to Immigrants from Syria by College, Under 1 year
In terms of college, under 1 year, the demographic groups most similar to Immigrants from Syria are Finnish (66.9%, a difference of 0.040%), Immigrants from Eastern Africa (67.0%, a difference of 0.060%), Polish (66.9%, a difference of 0.060%), Immigrants from Brazil (66.9%, a difference of 0.070%), and Iraqi (66.8%, a difference of 0.11%).
| Demographics | Rating | Rank | College, Under 1 year |
| Immigrants | Northern Africa | 92.7 /100 | #123 | Exceptional 67.2% |
| Arabs | 92.6 /100 | #124 | Exceptional 67.2% |
| Italians | 91.8 /100 | #125 | Exceptional 67.2% |
| Alsatians | 91.3 /100 | #126 | Exceptional 67.1% |
| Czechs | 90.8 /100 | #127 | Exceptional 67.1% |
| Scottish | 90.2 /100 | #128 | Exceptional 67.0% |
| Immigrants | Eastern Africa | 89.5 /100 | #129 | Excellent 67.0% |
| Immigrants | Syria | 89.0 /100 | #130 | Excellent 66.9% |
| Finns | 88.6 /100 | #131 | Excellent 66.9% |
| Poles | 88.4 /100 | #132 | Excellent 66.9% |
| Immigrants | Brazil | 88.3 /100 | #133 | Excellent 66.9% |
| Iraqis | 88.0 /100 | #134 | Excellent 66.8% |
| Canadians | 87.9 /100 | #135 | Excellent 66.8% |
| Ugandans | 87.8 /100 | #136 | Excellent 66.8% |
| Immigrants | Chile | 87.4 /100 | #137 | Excellent 66.8% |