Ghanaian vs Eastern European Male Unemployment
COMPARE
Ghanaian
Eastern European
Male Unemployment
Male Unemployment Comparison
Ghanaians
Eastern Europeans
6.1%
MALE UNEMPLOYMENT
0.0/ 100
METRIC RATING
279th/ 347
METRIC RANK
5.0%
MALE UNEMPLOYMENT
97.9/ 100
METRIC RATING
63rd/ 347
METRIC RANK
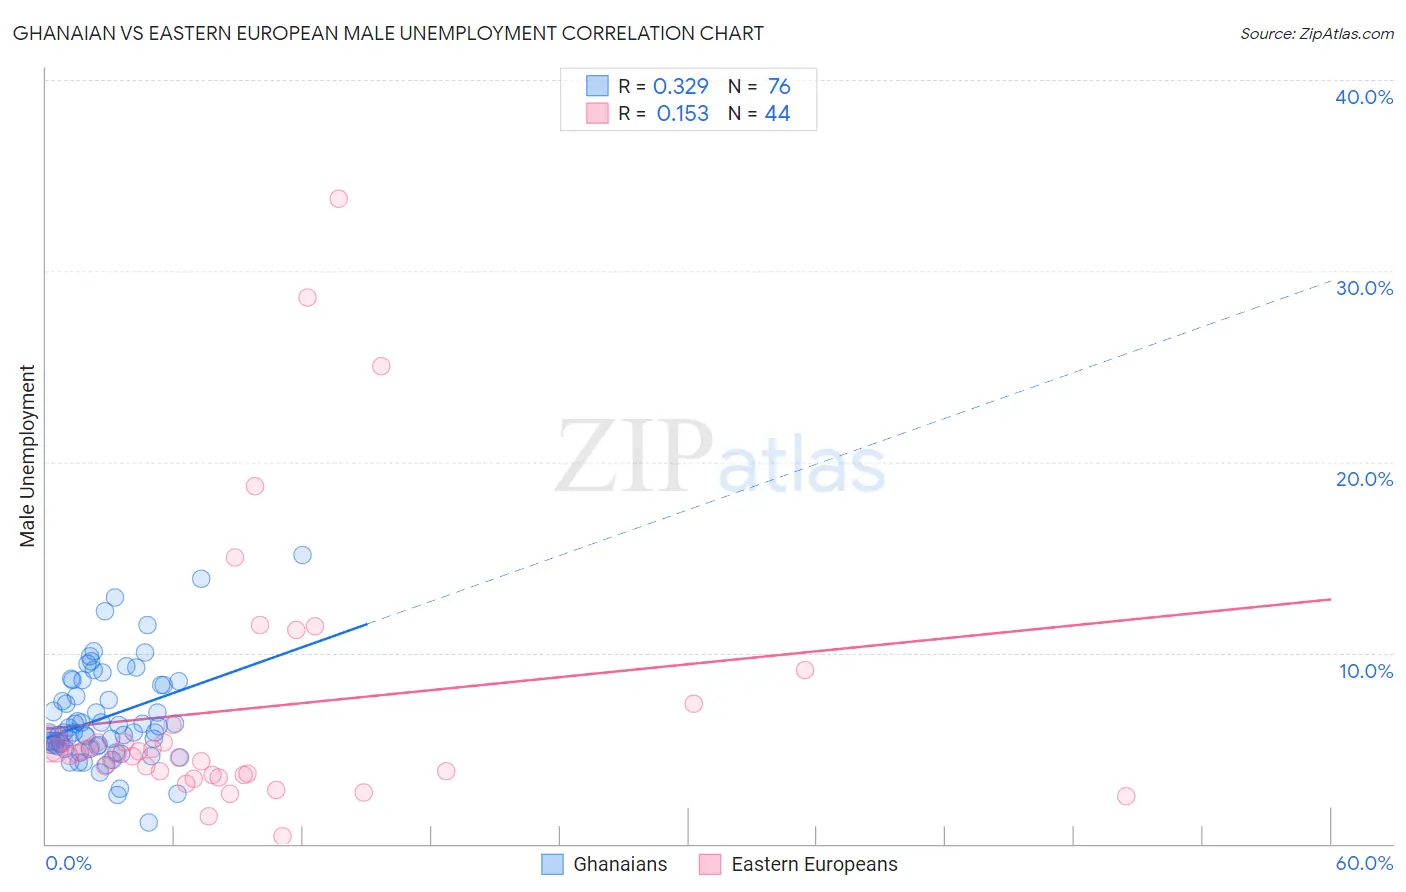
Ghanaian vs Eastern European Male Unemployment Correlation Chart
The statistical analysis conducted on geographies consisting of 190,397,000 people shows a mild positive correlation between the proportion of Ghanaians and unemployment rate among males in the United States with a correlation coefficient (R) of 0.329 and weighted average of 6.1%. Similarly, the statistical analysis conducted on geographies consisting of 457,878,512 people shows a poor positive correlation between the proportion of Eastern Europeans and unemployment rate among males in the United States with a correlation coefficient (R) of 0.153 and weighted average of 5.0%, a difference of 21.9%.
Male Unemployment Correlation Summary
| Measurement | Ghanaian | Eastern European |
| Minimum | 1.1% | 0.41% |
| Maximum | 15.1% | 33.8% |
| Range | 14.0% | 33.4% |
| Mean | 6.6% | 7.0% |
| Median | 5.8% | 4.7% |
| Interquartile 25% (IQ1) | 5.1% | 3.6% |
| Interquartile 75% (IQ3) | 8.3% | 5.8% |
| Interquartile Range (IQR) | 3.2% | 2.2% |
| Standard Deviation (Sample) | 2.6% | 7.0% |
| Standard Deviation (Population) | 2.5% | 6.9% |
Similar Demographics by Male Unemployment
Demographics Similar to Ghanaians by Male Unemployment
In terms of male unemployment, the demographic groups most similar to Ghanaians are Immigrants from Fiji (6.1%, a difference of 0.50%), Immigrants from Liberia (6.1%, a difference of 0.62%), Immigrants from Ghana (6.2%, a difference of 0.99%), Tlingit-Haida (6.0%, a difference of 1.1%), and Sierra Leonean (6.2%, a difference of 1.1%).
| Demographics | Rating | Rank | Male Unemployment |
| Immigrants | Uzbekistan | 0.0 /100 | #272 | Tragic 6.0% |
| Armenians | 0.0 /100 | #273 | Tragic 6.0% |
| Immigrants | Sierra Leone | 0.0 /100 | #274 | Tragic 6.0% |
| Menominee | 0.0 /100 | #275 | Tragic 6.0% |
| Tlingit-Haida | 0.0 /100 | #276 | Tragic 6.0% |
| Immigrants | Liberia | 0.0 /100 | #277 | Tragic 6.1% |
| Immigrants | Fiji | 0.0 /100 | #278 | Tragic 6.1% |
| Ghanaians | 0.0 /100 | #279 | Tragic 6.1% |
| Immigrants | Ghana | 0.0 /100 | #280 | Tragic 6.2% |
| Sierra Leoneans | 0.0 /100 | #281 | Tragic 6.2% |
| Ecuadorians | 0.0 /100 | #282 | Tragic 6.2% |
| Immigrants | Western Africa | 0.0 /100 | #283 | Tragic 6.2% |
| Spanish American Indians | 0.0 /100 | #284 | Tragic 6.2% |
| Immigrants | Ecuador | 0.0 /100 | #285 | Tragic 6.2% |
| Africans | 0.0 /100 | #286 | Tragic 6.3% |
Demographics Similar to Eastern Europeans by Male Unemployment
In terms of male unemployment, the demographic groups most similar to Eastern Europeans are Basque (5.0%, a difference of 0.010%), Celtic (5.0%, a difference of 0.020%), Cambodian (5.0%, a difference of 0.14%), Icelander (5.0%, a difference of 0.18%), and Immigrants from Argentina (5.0%, a difference of 0.22%).
| Demographics | Rating | Rank | Male Unemployment |
| Immigrants | Bulgaria | 98.7 /100 | #56 | Exceptional 5.0% |
| Turks | 98.5 /100 | #57 | Exceptional 5.0% |
| Lithuanians | 98.5 /100 | #58 | Exceptional 5.0% |
| Immigrants | Netherlands | 98.3 /100 | #59 | Exceptional 5.0% |
| Immigrants | Argentina | 98.1 /100 | #60 | Exceptional 5.0% |
| Cambodians | 98.1 /100 | #61 | Exceptional 5.0% |
| Basques | 97.9 /100 | #62 | Exceptional 5.0% |
| Eastern Europeans | 97.9 /100 | #63 | Exceptional 5.0% |
| Celtics | 97.8 /100 | #64 | Exceptional 5.0% |
| Icelanders | 97.6 /100 | #65 | Exceptional 5.0% |
| Finns | 97.5 /100 | #66 | Exceptional 5.0% |
| Immigrants | Canada | 97.5 /100 | #67 | Exceptional 5.0% |
| Australians | 97.4 /100 | #68 | Exceptional 5.0% |
| Immigrants | Sweden | 97.4 /100 | #69 | Exceptional 5.0% |
| Whites/Caucasians | 97.3 /100 | #70 | Exceptional 5.0% |