Paraguayan vs Yaqui Unemployment Among Ages 16 to 19 years
COMPARE
Paraguayan
Yaqui
Unemployment Among Ages 16 to 19 years
Unemployment Among Ages 16 to 19 years Comparison
Paraguayans
Yaqui
19.4%
UNEMPLOYMENT AMONG AGES 16 TO 19 YEARS
0.0/ 100
METRIC RATING
275th/ 347
METRIC RANK
19.0%
UNEMPLOYMENT AMONG AGES 16 TO 19 YEARS
0.1/ 100
METRIC RATING
264th/ 347
METRIC RANK
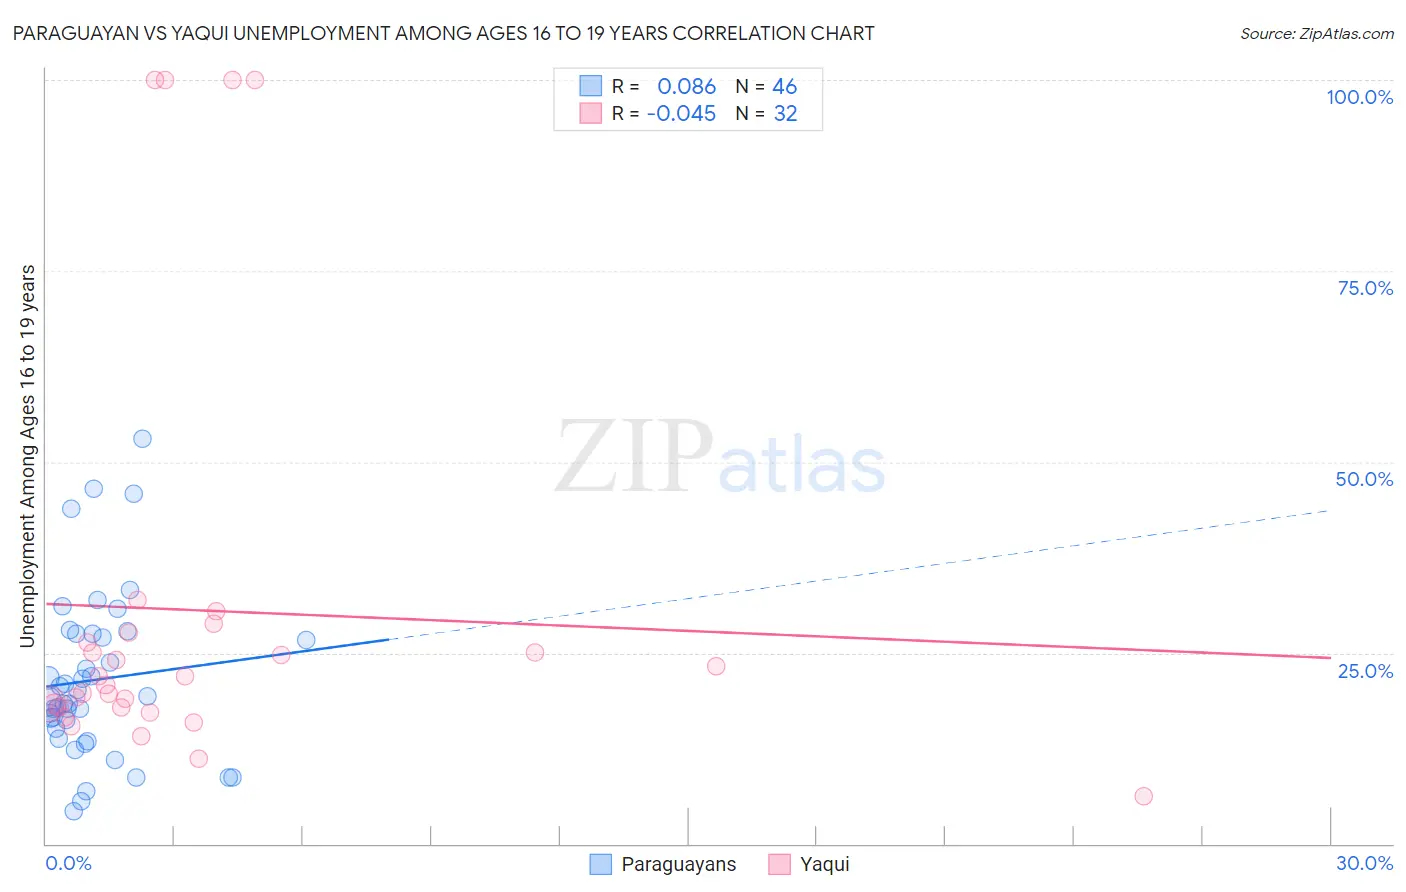
Paraguayan vs Yaqui Unemployment Among Ages 16 to 19 years Correlation Chart
The statistical analysis conducted on geographies consisting of 93,293,455 people shows a slight positive correlation between the proportion of Paraguayans and unemployment rate among population between the ages 16 and 19 in the United States with a correlation coefficient (R) of 0.086 and weighted average of 19.4%. Similarly, the statistical analysis conducted on geographies consisting of 105,605,513 people shows no correlation between the proportion of Yaqui and unemployment rate among population between the ages 16 and 19 in the United States with a correlation coefficient (R) of -0.045 and weighted average of 19.0%, a difference of 2.1%.
Unemployment Among Ages 16 to 19 years Correlation Summary
| Measurement | Paraguayan | Yaqui |
| Minimum | 4.3% | 6.3% |
| Maximum | 53.1% | 100.0% |
| Range | 48.8% | 93.7% |
| Mean | 21.5% | 30.6% |
| Median | 19.0% | 21.3% |
| Interquartile 25% (IQ1) | 15.1% | 17.9% |
| Interquartile 75% (IQ3) | 27.5% | 27.0% |
| Interquartile Range (IQR) | 12.4% | 9.1% |
| Standard Deviation (Sample) | 10.8% | 27.2% |
| Standard Deviation (Population) | 10.7% | 26.8% |
Demographics Similar to Paraguayans and Yaqui by Unemployment Among Ages 16 to 19 years
In terms of unemployment among ages 16 to 19 years, the demographic groups most similar to Paraguayans are Immigrants from Latin America (19.4%, a difference of 0.090%), Shoshone (19.3%, a difference of 0.33%), Immigrants from Western Africa (19.4%, a difference of 0.42%), Immigrants from Panama (19.3%, a difference of 0.47%), and Hispanic or Latino (19.2%, a difference of 0.60%). Similarly, the demographic groups most similar to Yaqui are Choctaw (19.0%, a difference of 0.010%), Cree (19.0%, a difference of 0.030%), Immigrants from Honduras (19.0%, a difference of 0.10%), Salvadoran (18.9%, a difference of 0.16%), and Spanish American Indian (18.9%, a difference of 0.20%).
| Demographics | Rating | Rank | Unemployment Among Ages 16 to 19 years |
| Immigrants | Central America | 0.2 /100 | #259 | Tragic 18.9% |
| Nigerians | 0.2 /100 | #260 | Tragic 18.9% |
| Spanish American Indians | 0.1 /100 | #261 | Tragic 18.9% |
| Salvadorans | 0.1 /100 | #262 | Tragic 18.9% |
| Cree | 0.1 /100 | #263 | Tragic 19.0% |
| Yaqui | 0.1 /100 | #264 | Tragic 19.0% |
| Choctaw | 0.1 /100 | #265 | Tragic 19.0% |
| Immigrants | Honduras | 0.1 /100 | #266 | Tragic 19.0% |
| Israelis | 0.1 /100 | #267 | Tragic 19.0% |
| Immigrants | El Salvador | 0.1 /100 | #268 | Tragic 19.1% |
| Lumbee | 0.1 /100 | #269 | Tragic 19.1% |
| Hondurans | 0.1 /100 | #270 | Tragic 19.2% |
| Blackfeet | 0.0 /100 | #271 | Tragic 19.2% |
| Hispanics or Latinos | 0.0 /100 | #272 | Tragic 19.2% |
| Immigrants | Panama | 0.0 /100 | #273 | Tragic 19.3% |
| Shoshone | 0.0 /100 | #274 | Tragic 19.3% |
| Paraguayans | 0.0 /100 | #275 | Tragic 19.4% |
| Immigrants | Latin America | 0.0 /100 | #276 | Tragic 19.4% |
| Immigrants | Western Africa | 0.0 /100 | #277 | Tragic 19.4% |
| Africans | 0.0 /100 | #278 | Tragic 19.5% |
| Ute | 0.0 /100 | #279 | Tragic 19.6% |