Paraguayan vs Yaqui Householder Income Ages 25 - 44 years
COMPARE
Paraguayan
Yaqui
Householder Income Ages 25 - 44 years
Householder Income Ages 25 - 44 years Comparison
Paraguayans
Yaqui
$106,615
HOUSEHOLDER INCOME AGES 25 - 44 YEARS
99.9/ 100
METRIC RATING
54th/ 347
METRIC RANK
$81,656
HOUSEHOLDER INCOME AGES 25 - 44 YEARS
0.1/ 100
METRIC RATING
292nd/ 347
METRIC RANK
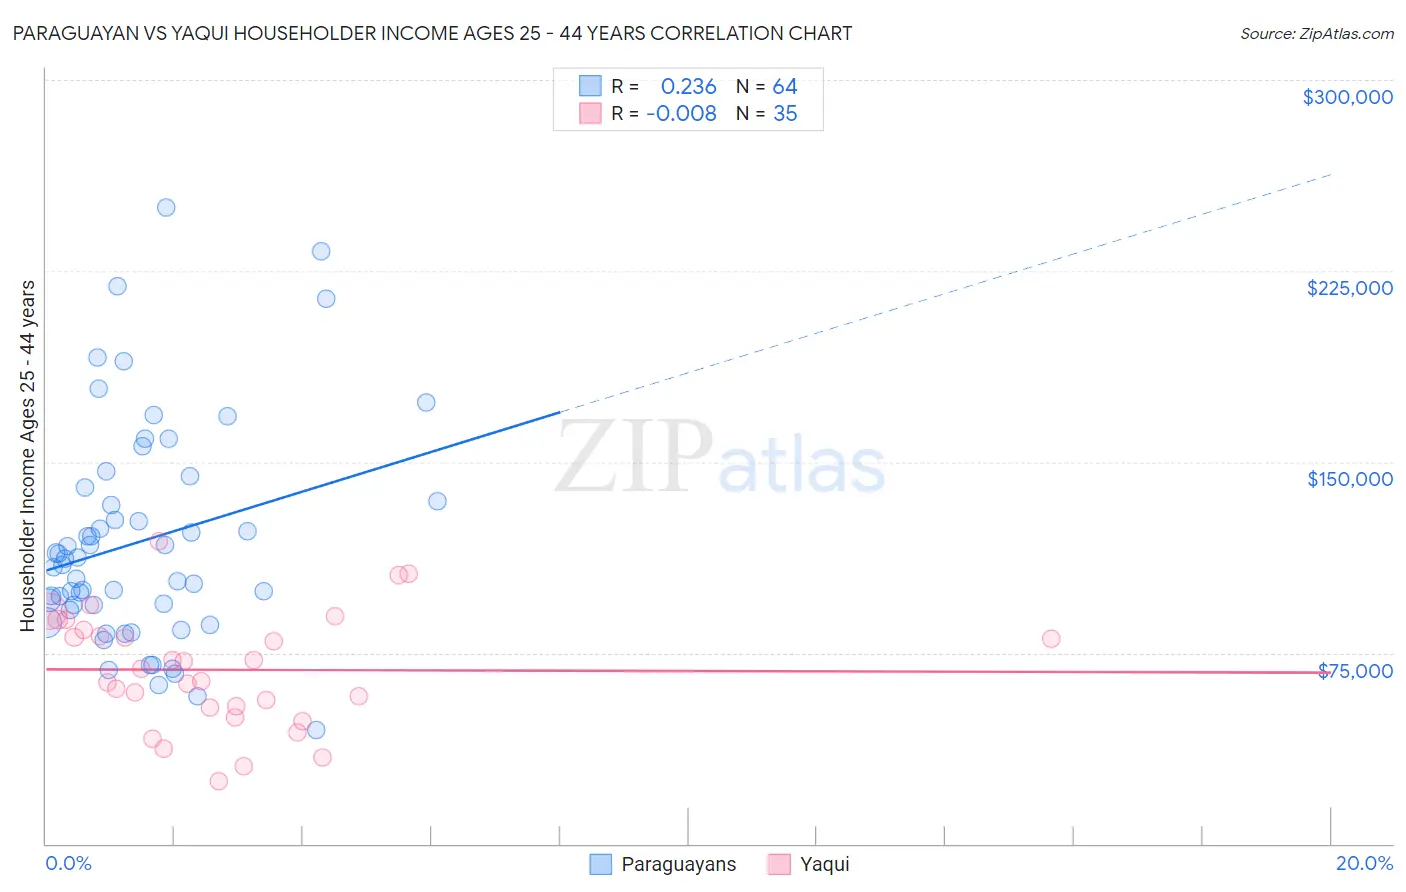
Paraguayan vs Yaqui Householder Income Ages 25 - 44 years Correlation Chart
The statistical analysis conducted on geographies consisting of 95,064,086 people shows a weak positive correlation between the proportion of Paraguayans and household income with householder between the ages 25 and 44 in the United States with a correlation coefficient (R) of 0.236 and weighted average of $106,615. Similarly, the statistical analysis conducted on geographies consisting of 107,629,543 people shows no correlation between the proportion of Yaqui and household income with householder between the ages 25 and 44 in the United States with a correlation coefficient (R) of -0.008 and weighted average of $81,656, a difference of 30.6%.
Householder Income Ages 25 - 44 years Correlation Summary
| Measurement | Paraguayan | Yaqui |
| Minimum | $44,531 | $24,313 |
| Maximum | $250,001 | $118,928 |
| Range | $205,470 | $94,615 |
| Mean | $118,848 | $68,343 |
| Median | $110,860 | $68,776 |
| Interquartile 25% (IQ1) | $92,713 | $53,438 |
| Interquartile 75% (IQ3) | $137,201 | $83,858 |
| Interquartile Range (IQR) | $44,488 | $30,420 |
| Standard Deviation (Sample) | $43,421 | $22,560 |
| Standard Deviation (Population) | $43,080 | $22,236 |
Similar Demographics by Householder Income Ages 25 - 44 years
Demographics Similar to Paraguayans by Householder Income Ages 25 - 44 years
In terms of householder income ages 25 - 44 years, the demographic groups most similar to Paraguayans are Immigrants from Norway ($106,629, a difference of 0.010%), Greek ($106,457, a difference of 0.15%), Immigrants from Europe ($106,817, a difference of 0.19%), Immigrants from Czechoslovakia ($106,888, a difference of 0.26%), and Immigrants from Pakistan ($106,129, a difference of 0.46%).
| Demographics | Rating | Rank | Householder Income Ages 25 - 44 years |
| Estonians | 99.9 /100 | #47 | Exceptional $107,269 |
| Bulgarians | 99.9 /100 | #48 | Exceptional $107,264 |
| Immigrants | Turkey | 99.9 /100 | #49 | Exceptional $107,258 |
| Cambodians | 99.9 /100 | #50 | Exceptional $107,148 |
| Immigrants | Czechoslovakia | 99.9 /100 | #51 | Exceptional $106,888 |
| Immigrants | Europe | 99.9 /100 | #52 | Exceptional $106,817 |
| Immigrants | Norway | 99.9 /100 | #53 | Exceptional $106,629 |
| Paraguayans | 99.9 /100 | #54 | Exceptional $106,615 |
| Greeks | 99.9 /100 | #55 | Exceptional $106,457 |
| Immigrants | Pakistan | 99.8 /100 | #56 | Exceptional $106,129 |
| Immigrants | Austria | 99.8 /100 | #57 | Exceptional $106,103 |
| Immigrants | South Africa | 99.8 /100 | #58 | Exceptional $105,748 |
| Immigrants | Latvia | 99.8 /100 | #59 | Exceptional $105,522 |
| Egyptians | 99.7 /100 | #60 | Exceptional $105,282 |
| Lithuanians | 99.7 /100 | #61 | Exceptional $105,223 |
Demographics Similar to Yaqui by Householder Income Ages 25 - 44 years
In terms of householder income ages 25 - 44 years, the demographic groups most similar to Yaqui are Potawatomi ($81,774, a difference of 0.14%), Blackfeet ($81,531, a difference of 0.15%), Cuban ($81,483, a difference of 0.21%), Bangladeshi ($81,363, a difference of 0.36%), and Immigrants from Dominica ($81,351, a difference of 0.37%).
| Demographics | Rating | Rank | Householder Income Ages 25 - 44 years |
| Immigrants | Somalia | 0.1 /100 | #285 | Tragic $82,188 |
| Ute | 0.1 /100 | #286 | Tragic $82,166 |
| Immigrants | Latin America | 0.1 /100 | #287 | Tragic $82,166 |
| Comanche | 0.1 /100 | #288 | Tragic $82,152 |
| Shoshone | 0.1 /100 | #289 | Tragic $82,062 |
| Liberians | 0.1 /100 | #290 | Tragic $82,005 |
| Potawatomi | 0.1 /100 | #291 | Tragic $81,774 |
| Yaqui | 0.1 /100 | #292 | Tragic $81,656 |
| Blackfeet | 0.1 /100 | #293 | Tragic $81,531 |
| Cubans | 0.1 /100 | #294 | Tragic $81,483 |
| Bangladeshis | 0.1 /100 | #295 | Tragic $81,363 |
| Immigrants | Dominica | 0.1 /100 | #296 | Tragic $81,351 |
| Immigrants | Guatemala | 0.1 /100 | #297 | Tragic $81,341 |
| Dominicans | 0.1 /100 | #298 | Tragic $81,229 |
| Immigrants | Liberia | 0.1 /100 | #299 | Tragic $80,863 |