Paraguayan vs Afghan Unemployment Among Ages 16 to 19 years
COMPARE
Paraguayan
Afghan
Unemployment Among Ages 16 to 19 years
Unemployment Among Ages 16 to 19 years Comparison
Paraguayans
Afghans
19.4%
UNEMPLOYMENT AMONG AGES 16 TO 19 YEARS
0.0/ 100
METRIC RATING
275th/ 347
METRIC RANK
17.4%
UNEMPLOYMENT AMONG AGES 16 TO 19 YEARS
68.1/ 100
METRIC RATING
154th/ 347
METRIC RANK
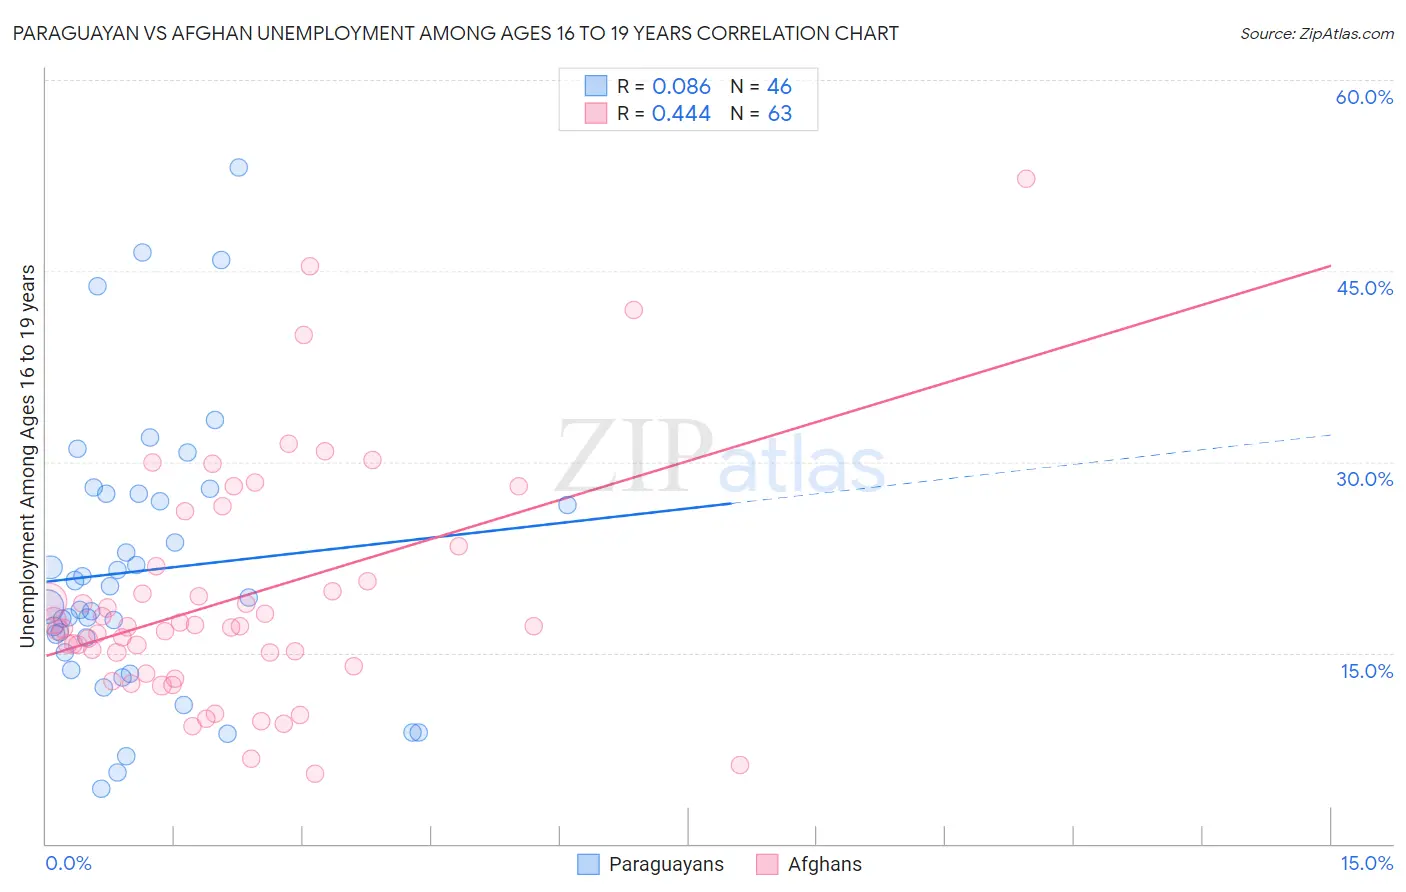
Paraguayan vs Afghan Unemployment Among Ages 16 to 19 years Correlation Chart
The statistical analysis conducted on geographies consisting of 93,293,455 people shows a slight positive correlation between the proportion of Paraguayans and unemployment rate among population between the ages 16 and 19 in the United States with a correlation coefficient (R) of 0.086 and weighted average of 19.4%. Similarly, the statistical analysis conducted on geographies consisting of 146,044,313 people shows a moderate positive correlation between the proportion of Afghans and unemployment rate among population between the ages 16 and 19 in the United States with a correlation coefficient (R) of 0.444 and weighted average of 17.4%, a difference of 11.2%.
Unemployment Among Ages 16 to 19 years Correlation Summary
| Measurement | Paraguayan | Afghan |
| Minimum | 4.3% | 5.5% |
| Maximum | 53.1% | 52.2% |
| Range | 48.8% | 46.7% |
| Mean | 21.5% | 19.3% |
| Median | 19.0% | 17.0% |
| Interquartile 25% (IQ1) | 15.1% | 13.9% |
| Interquartile 75% (IQ3) | 27.5% | 21.8% |
| Interquartile Range (IQR) | 12.4% | 7.9% |
| Standard Deviation (Sample) | 10.8% | 9.2% |
| Standard Deviation (Population) | 10.7% | 9.1% |
Similar Demographics by Unemployment Among Ages 16 to 19 years
Demographics Similar to Paraguayans by Unemployment Among Ages 16 to 19 years
In terms of unemployment among ages 16 to 19 years, the demographic groups most similar to Paraguayans are Immigrants from Latin America (19.4%, a difference of 0.090%), Shoshone (19.3%, a difference of 0.33%), Immigrants from Western Africa (19.4%, a difference of 0.42%), Immigrants from Panama (19.3%, a difference of 0.47%), and Hispanic or Latino (19.2%, a difference of 0.60%).
| Demographics | Rating | Rank | Unemployment Among Ages 16 to 19 years |
| Immigrants | El Salvador | 0.1 /100 | #268 | Tragic 19.1% |
| Lumbee | 0.1 /100 | #269 | Tragic 19.1% |
| Hondurans | 0.1 /100 | #270 | Tragic 19.2% |
| Blackfeet | 0.0 /100 | #271 | Tragic 19.2% |
| Hispanics or Latinos | 0.0 /100 | #272 | Tragic 19.2% |
| Immigrants | Panama | 0.0 /100 | #273 | Tragic 19.3% |
| Shoshone | 0.0 /100 | #274 | Tragic 19.3% |
| Paraguayans | 0.0 /100 | #275 | Tragic 19.4% |
| Immigrants | Latin America | 0.0 /100 | #276 | Tragic 19.4% |
| Immigrants | Western Africa | 0.0 /100 | #277 | Tragic 19.4% |
| Africans | 0.0 /100 | #278 | Tragic 19.5% |
| Ute | 0.0 /100 | #279 | Tragic 19.6% |
| Cajuns | 0.0 /100 | #280 | Tragic 19.6% |
| Cypriots | 0.0 /100 | #281 | Tragic 19.6% |
| Dutch West Indians | 0.0 /100 | #282 | Tragic 19.7% |
Demographics Similar to Afghans by Unemployment Among Ages 16 to 19 years
In terms of unemployment among ages 16 to 19 years, the demographic groups most similar to Afghans are Immigrants from Afghanistan (17.4%, a difference of 0.020%), Immigrants from Northern Africa (17.4%, a difference of 0.050%), Portuguese (17.4%, a difference of 0.050%), Immigrants from Hong Kong (17.4%, a difference of 0.060%), and Costa Rican (17.4%, a difference of 0.12%).
| Demographics | Rating | Rank | Unemployment Among Ages 16 to 19 years |
| Tsimshian | 76.0 /100 | #147 | Good 17.3% |
| Romanians | 74.9 /100 | #148 | Good 17.3% |
| Immigrants | Eastern Asia | 73.8 /100 | #149 | Good 17.4% |
| Immigrants | Northern Europe | 72.5 /100 | #150 | Good 17.4% |
| Immigrants | Hong Kong | 69.3 /100 | #151 | Good 17.4% |
| Immigrants | Northern Africa | 69.0 /100 | #152 | Good 17.4% |
| Immigrants | Afghanistan | 68.6 /100 | #153 | Good 17.4% |
| Afghans | 68.1 /100 | #154 | Good 17.4% |
| Portuguese | 67.3 /100 | #155 | Good 17.4% |
| Costa Ricans | 65.9 /100 | #156 | Good 17.4% |
| Uruguayans | 64.3 /100 | #157 | Good 17.5% |
| Immigrants | China | 64.1 /100 | #158 | Good 17.5% |
| Koreans | 61.0 /100 | #159 | Good 17.5% |
| Ukrainians | 60.5 /100 | #160 | Good 17.5% |
| Immigrants | Denmark | 60.3 /100 | #161 | Good 17.5% |