Osage vs Peruvian Unemployment Among Ages 16 to 19 years
COMPARE
Osage
Peruvian
Unemployment Among Ages 16 to 19 years
Unemployment Among Ages 16 to 19 years Comparison
Osage
Peruvians
17.6%
UNEMPLOYMENT AMONG AGES 16 TO 19 YEARS
50.0/ 100
METRIC RATING
174th/ 347
METRIC RANK
17.7%
UNEMPLOYMENT AMONG AGES 16 TO 19 YEARS
38.8/ 100
METRIC RATING
194th/ 347
METRIC RANK
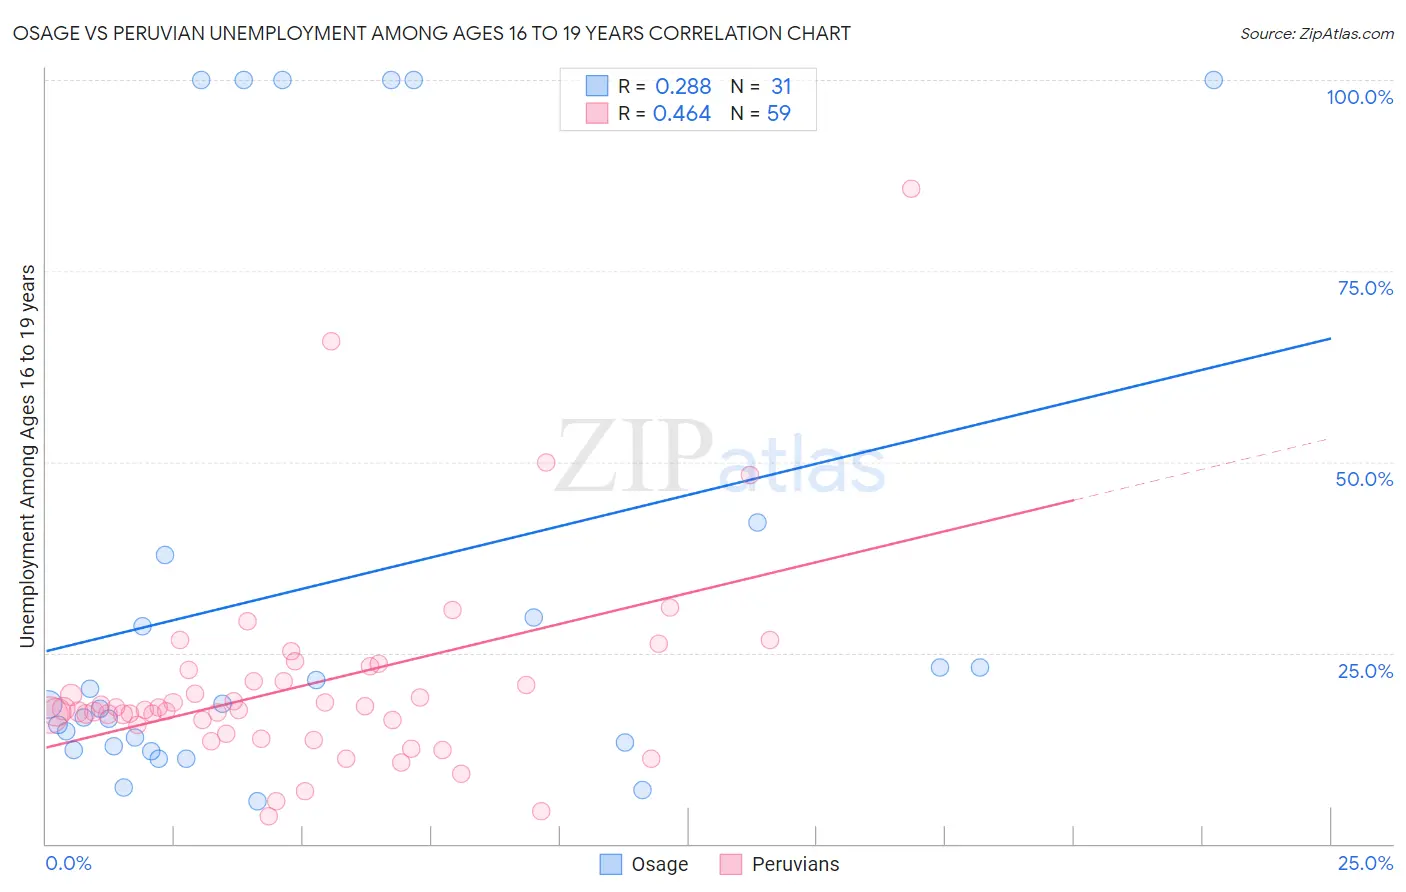
Osage vs Peruvian Unemployment Among Ages 16 to 19 years Correlation Chart
The statistical analysis conducted on geographies consisting of 89,906,286 people shows a weak positive correlation between the proportion of Osage and unemployment rate among population between the ages 16 and 19 in the United States with a correlation coefficient (R) of 0.288 and weighted average of 17.6%. Similarly, the statistical analysis conducted on geographies consisting of 348,011,157 people shows a moderate positive correlation between the proportion of Peruvians and unemployment rate among population between the ages 16 and 19 in the United States with a correlation coefficient (R) of 0.464 and weighted average of 17.7%, a difference of 0.54%.
Unemployment Among Ages 16 to 19 years Correlation Summary
| Measurement | Osage | Peruvian |
| Minimum | 5.5% | 3.6% |
| Maximum | 100.0% | 85.7% |
| Range | 94.5% | 82.1% |
| Mean | 33.9% | 20.7% |
| Median | 18.2% | 17.5% |
| Interquartile 25% (IQ1) | 12.7% | 15.6% |
| Interquartile 75% (IQ3) | 37.8% | 22.8% |
| Interquartile Range (IQR) | 25.1% | 7.2% |
| Standard Deviation (Sample) | 33.9% | 13.3% |
| Standard Deviation (Population) | 33.4% | 13.2% |
Demographics Similar to Osage and Peruvians by Unemployment Among Ages 16 to 19 years
In terms of unemployment among ages 16 to 19 years, the demographic groups most similar to Osage are Immigrants from Sweden (17.6%, a difference of 0.040%), Nicaraguan (17.6%, a difference of 0.050%), Bermudan (17.6%, a difference of 0.060%), Celtic (17.6%, a difference of 0.060%), and American (17.6%, a difference of 0.12%). Similarly, the demographic groups most similar to Peruvians are Immigrants from Australia (17.7%, a difference of 0.090%), Immigrants from Philippines (17.7%, a difference of 0.10%), Immigrants from Costa Rica (17.6%, a difference of 0.12%), Marshallese (17.6%, a difference of 0.14%), and Immigrants from Europe (17.6%, a difference of 0.15%).
| Demographics | Rating | Rank | Unemployment Among Ages 16 to 19 years |
| Osage | 50.0 /100 | #174 | Average 17.6% |
| Immigrants | Sweden | 49.1 /100 | #175 | Average 17.6% |
| Nicaraguans | 48.9 /100 | #176 | Average 17.6% |
| Bermudans | 48.7 /100 | #177 | Average 17.6% |
| Celtics | 48.7 /100 | #178 | Average 17.6% |
| Americans | 47.4 /100 | #179 | Average 17.6% |
| Spaniards | 47.1 /100 | #180 | Average 17.6% |
| Immigrants | Turkey | 45.6 /100 | #181 | Average 17.6% |
| Russians | 45.2 /100 | #182 | Average 17.6% |
| Immigrants | Uruguay | 44.6 /100 | #183 | Average 17.6% |
| Eastern Europeans | 44.3 /100 | #184 | Average 17.6% |
| Iroquois | 43.4 /100 | #185 | Average 17.6% |
| Japanese | 43.2 /100 | #186 | Average 17.6% |
| Immigrants | Micronesia | 42.4 /100 | #187 | Average 17.6% |
| Immigrants | Nicaragua | 42.2 /100 | #188 | Average 17.6% |
| Immigrants | Europe | 41.8 /100 | #189 | Average 17.6% |
| Marshallese | 41.7 /100 | #190 | Average 17.6% |
| Immigrants | Costa Rica | 41.3 /100 | #191 | Average 17.6% |
| Immigrants | Philippines | 40.7 /100 | #192 | Average 17.7% |
| Immigrants | Australia | 40.6 /100 | #193 | Average 17.7% |
| Peruvians | 38.8 /100 | #194 | Fair 17.7% |