Immigrants from El Salvador vs Peruvian Unemployment Among Ages 16 to 19 years
COMPARE
Immigrants from El Salvador
Peruvian
Unemployment Among Ages 16 to 19 years
Unemployment Among Ages 16 to 19 years Comparison
Immigrants from El Salvador
Peruvians
19.1%
UNEMPLOYMENT AMONG AGES 16 TO 19 YEARS
0.1/ 100
METRIC RATING
268th/ 347
METRIC RANK
17.7%
UNEMPLOYMENT AMONG AGES 16 TO 19 YEARS
38.8/ 100
METRIC RATING
194th/ 347
METRIC RANK
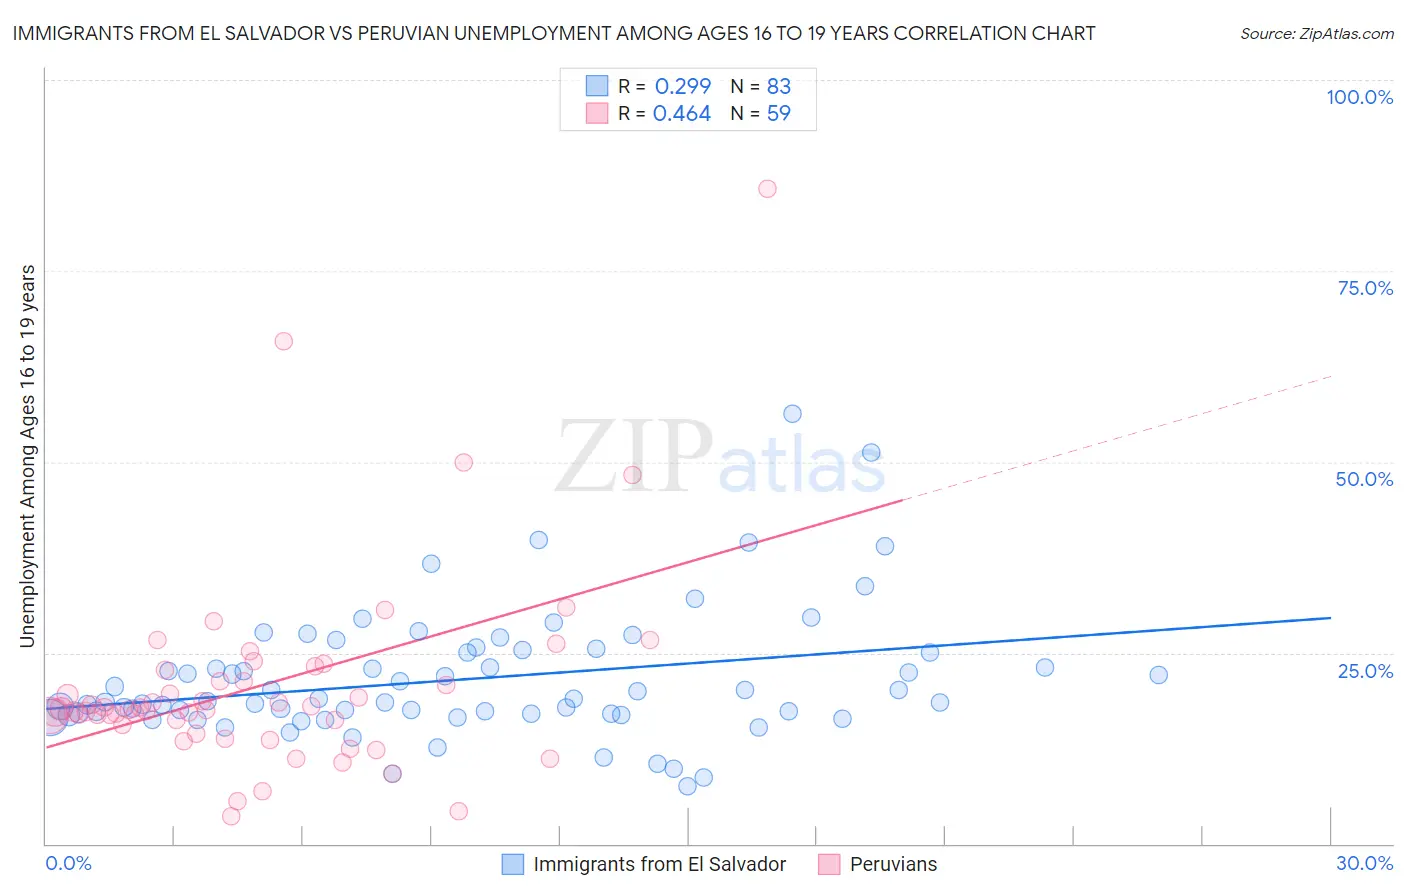
Immigrants from El Salvador vs Peruvian Unemployment Among Ages 16 to 19 years Correlation Chart
The statistical analysis conducted on geographies consisting of 342,569,463 people shows a weak positive correlation between the proportion of Immigrants from El Salvador and unemployment rate among population between the ages 16 and 19 in the United States with a correlation coefficient (R) of 0.299 and weighted average of 19.1%. Similarly, the statistical analysis conducted on geographies consisting of 348,011,157 people shows a moderate positive correlation between the proportion of Peruvians and unemployment rate among population between the ages 16 and 19 in the United States with a correlation coefficient (R) of 0.464 and weighted average of 17.7%, a difference of 8.1%.
Unemployment Among Ages 16 to 19 years Correlation Summary
| Measurement | Immigrants from El Salvador | Peruvian |
| Minimum | 7.6% | 3.6% |
| Maximum | 56.3% | 85.7% |
| Range | 48.7% | 82.1% |
| Mean | 21.5% | 20.7% |
| Median | 18.6% | 17.5% |
| Interquartile 25% (IQ1) | 17.0% | 15.6% |
| Interquartile 75% (IQ3) | 25.1% | 22.8% |
| Interquartile Range (IQR) | 8.1% | 7.2% |
| Standard Deviation (Sample) | 8.4% | 13.3% |
| Standard Deviation (Population) | 8.3% | 13.2% |
Similar Demographics by Unemployment Among Ages 16 to 19 years
Demographics Similar to Immigrants from El Salvador by Unemployment Among Ages 16 to 19 years
In terms of unemployment among ages 16 to 19 years, the demographic groups most similar to Immigrants from El Salvador are Lumbee (19.1%, a difference of 0.080%), Honduran (19.2%, a difference of 0.26%), Israeli (19.0%, a difference of 0.28%), Immigrants from Honduras (19.0%, a difference of 0.62%), and Blackfeet (19.2%, a difference of 0.64%).
| Demographics | Rating | Rank | Unemployment Among Ages 16 to 19 years |
| Spanish American Indians | 0.1 /100 | #261 | Tragic 18.9% |
| Salvadorans | 0.1 /100 | #262 | Tragic 18.9% |
| Cree | 0.1 /100 | #263 | Tragic 19.0% |
| Yaqui | 0.1 /100 | #264 | Tragic 19.0% |
| Choctaw | 0.1 /100 | #265 | Tragic 19.0% |
| Immigrants | Honduras | 0.1 /100 | #266 | Tragic 19.0% |
| Israelis | 0.1 /100 | #267 | Tragic 19.0% |
| Immigrants | El Salvador | 0.1 /100 | #268 | Tragic 19.1% |
| Lumbee | 0.1 /100 | #269 | Tragic 19.1% |
| Hondurans | 0.1 /100 | #270 | Tragic 19.2% |
| Blackfeet | 0.0 /100 | #271 | Tragic 19.2% |
| Hispanics or Latinos | 0.0 /100 | #272 | Tragic 19.2% |
| Immigrants | Panama | 0.0 /100 | #273 | Tragic 19.3% |
| Shoshone | 0.0 /100 | #274 | Tragic 19.3% |
| Paraguayans | 0.0 /100 | #275 | Tragic 19.4% |
Demographics Similar to Peruvians by Unemployment Among Ages 16 to 19 years
In terms of unemployment among ages 16 to 19 years, the demographic groups most similar to Peruvians are Immigrants from Peru (17.7%, a difference of 0.070%), Immigrants from Australia (17.7%, a difference of 0.090%), Immigrants from Philippines (17.7%, a difference of 0.10%), Immigrants from Costa Rica (17.6%, a difference of 0.12%), and Marshallese (17.6%, a difference of 0.14%).
| Demographics | Rating | Rank | Unemployment Among Ages 16 to 19 years |
| Immigrants | Micronesia | 42.4 /100 | #187 | Average 17.6% |
| Immigrants | Nicaragua | 42.2 /100 | #188 | Average 17.6% |
| Immigrants | Europe | 41.8 /100 | #189 | Average 17.6% |
| Marshallese | 41.7 /100 | #190 | Average 17.6% |
| Immigrants | Costa Rica | 41.3 /100 | #191 | Average 17.6% |
| Immigrants | Philippines | 40.7 /100 | #192 | Average 17.7% |
| Immigrants | Australia | 40.6 /100 | #193 | Average 17.7% |
| Peruvians | 38.8 /100 | #194 | Fair 17.7% |
| Immigrants | Peru | 37.3 /100 | #195 | Fair 17.7% |
| Alaskan Athabascans | 34.1 /100 | #196 | Fair 17.7% |
| Immigrants | Czechoslovakia | 29.8 /100 | #197 | Fair 17.8% |
| Ethiopians | 29.6 /100 | #198 | Fair 17.8% |
| Immigrants | Ireland | 28.5 /100 | #199 | Fair 17.8% |
| Immigrants | Fiji | 27.7 /100 | #200 | Fair 17.8% |
| Immigrants | Ethiopia | 27.4 /100 | #201 | Fair 17.8% |