Guamanian/Chamorro vs Peruvian Unemployment Among Ages 16 to 19 years
COMPARE
Guamanian/Chamorro
Peruvian
Unemployment Among Ages 16 to 19 years
Unemployment Among Ages 16 to 19 years Comparison
Guamanians/Chamorros
Peruvians
17.9%
UNEMPLOYMENT AMONG AGES 16 TO 19 YEARS
14.5/ 100
METRIC RATING
211th/ 347
METRIC RANK
17.7%
UNEMPLOYMENT AMONG AGES 16 TO 19 YEARS
38.8/ 100
METRIC RATING
194th/ 347
METRIC RANK
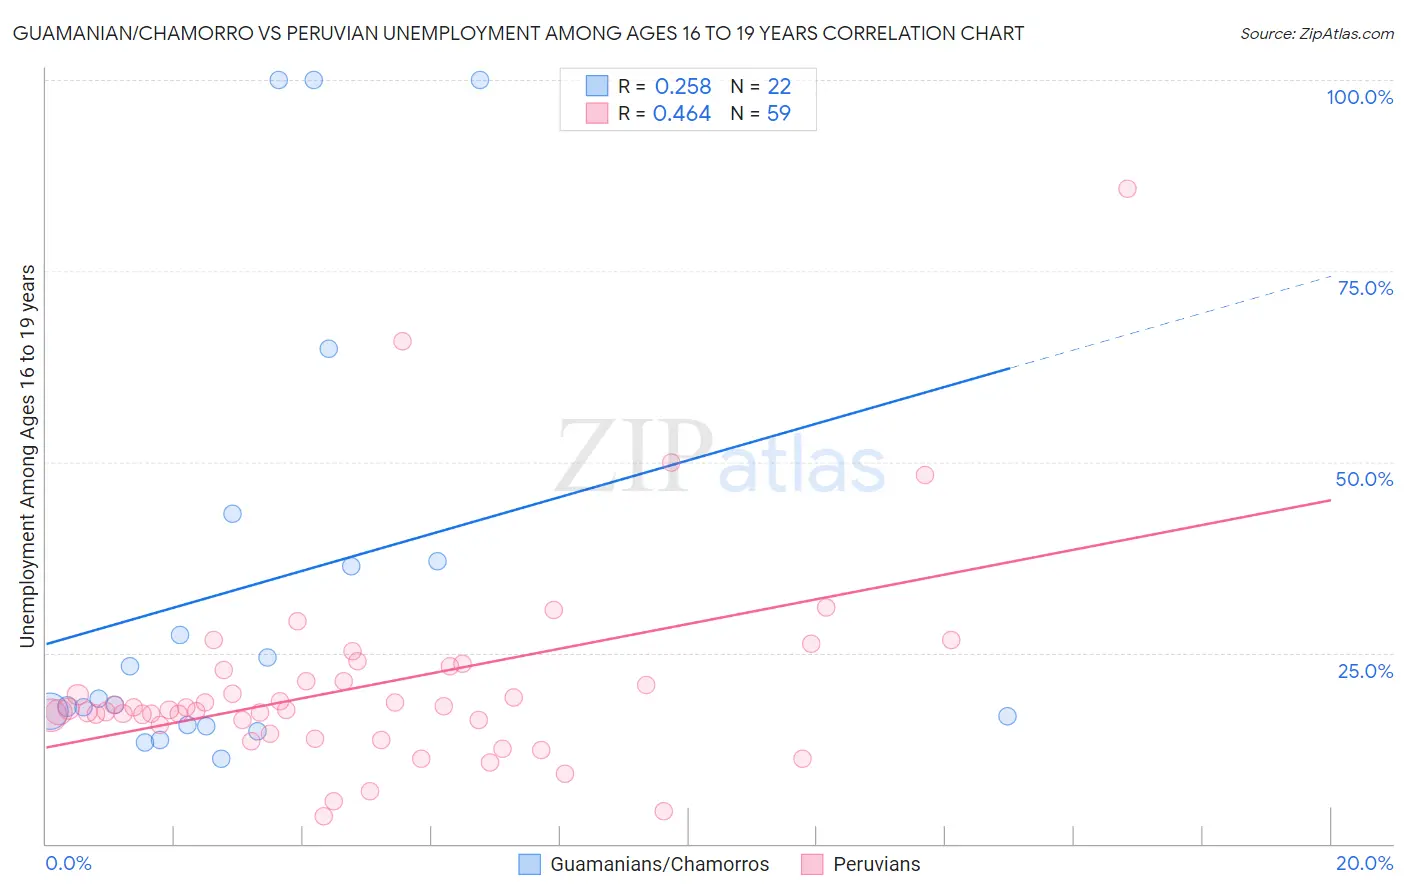
Guamanian/Chamorro vs Peruvian Unemployment Among Ages 16 to 19 years Correlation Chart
The statistical analysis conducted on geographies consisting of 216,501,963 people shows a weak positive correlation between the proportion of Guamanians/Chamorros and unemployment rate among population between the ages 16 and 19 in the United States with a correlation coefficient (R) of 0.258 and weighted average of 17.9%. Similarly, the statistical analysis conducted on geographies consisting of 348,011,157 people shows a moderate positive correlation between the proportion of Peruvians and unemployment rate among population between the ages 16 and 19 in the United States with a correlation coefficient (R) of 0.464 and weighted average of 17.7%, a difference of 1.5%.
Unemployment Among Ages 16 to 19 years Correlation Summary
| Measurement | Guamanian/Chamorro | Peruvian |
| Minimum | 11.1% | 3.6% |
| Maximum | 100.0% | 85.7% |
| Range | 88.9% | 82.1% |
| Mean | 33.9% | 20.7% |
| Median | 18.6% | 17.5% |
| Interquartile 25% (IQ1) | 15.6% | 15.6% |
| Interquartile 75% (IQ3) | 37.0% | 22.8% |
| Interquartile Range (IQR) | 21.4% | 7.2% |
| Standard Deviation (Sample) | 29.6% | 13.3% |
| Standard Deviation (Population) | 28.9% | 13.2% |
Demographics Similar to Guamanians/Chamorros and Peruvians by Unemployment Among Ages 16 to 19 years
In terms of unemployment among ages 16 to 19 years, the demographic groups most similar to Guamanians/Chamorros are Argentinean (18.0%, a difference of 0.060%), Carpatho Rusyn (17.9%, a difference of 0.10%), Cherokee (17.9%, a difference of 0.12%), Hawaiian (17.9%, a difference of 0.20%), and Liberian (17.9%, a difference of 0.35%). Similarly, the demographic groups most similar to Peruvians are Immigrants from Peru (17.7%, a difference of 0.070%), Immigrants from Australia (17.7%, a difference of 0.090%), Immigrants from Philippines (17.7%, a difference of 0.10%), Alaskan Athabascan (17.7%, a difference of 0.24%), and Immigrants from Czechoslovakia (17.8%, a difference of 0.47%).
| Demographics | Rating | Rank | Unemployment Among Ages 16 to 19 years |
| Immigrants | Philippines | 40.7 /100 | #192 | Average 17.7% |
| Immigrants | Australia | 40.6 /100 | #193 | Average 17.7% |
| Peruvians | 38.8 /100 | #194 | Fair 17.7% |
| Immigrants | Peru | 37.3 /100 | #195 | Fair 17.7% |
| Alaskan Athabascans | 34.1 /100 | #196 | Fair 17.7% |
| Immigrants | Czechoslovakia | 29.8 /100 | #197 | Fair 17.8% |
| Ethiopians | 29.6 /100 | #198 | Fair 17.8% |
| Immigrants | Ireland | 28.5 /100 | #199 | Fair 17.8% |
| Immigrants | Fiji | 27.7 /100 | #200 | Fair 17.8% |
| Immigrants | Ethiopia | 27.4 /100 | #201 | Fair 17.8% |
| Immigrants | Portugal | 27.2 /100 | #202 | Fair 17.8% |
| Immigrants | Eastern Europe | 23.6 /100 | #203 | Fair 17.8% |
| Immigrants | Nonimmigrants | 20.9 /100 | #204 | Fair 17.9% |
| Assyrians/Chaldeans/Syriacs | 20.8 /100 | #205 | Fair 17.9% |
| Immigrants | Southern Europe | 18.9 /100 | #206 | Poor 17.9% |
| Liberians | 18.6 /100 | #207 | Poor 17.9% |
| Hawaiians | 16.8 /100 | #208 | Poor 17.9% |
| Cherokee | 15.7 /100 | #209 | Poor 17.9% |
| Carpatho Rusyns | 15.6 /100 | #210 | Poor 17.9% |
| Guamanians/Chamorros | 14.5 /100 | #211 | Poor 17.9% |
| Argentineans | 13.8 /100 | #212 | Poor 18.0% |