Moroccan vs Senegalese Unemployment Among Youth under 25 years
COMPARE
Moroccan
Senegalese
Unemployment Among Youth under 25 years
Unemployment Among Youth under 25 years Comparison
Moroccans
Senegalese
12.1%
UNEMPLOYMENT AMONG YOUTH UNDER 25 YEARS
2.1/ 100
METRIC RATING
229th/ 347
METRIC RANK
13.5%
UNEMPLOYMENT AMONG YOUTH UNDER 25 YEARS
0.0/ 100
METRIC RATING
296th/ 347
METRIC RANK
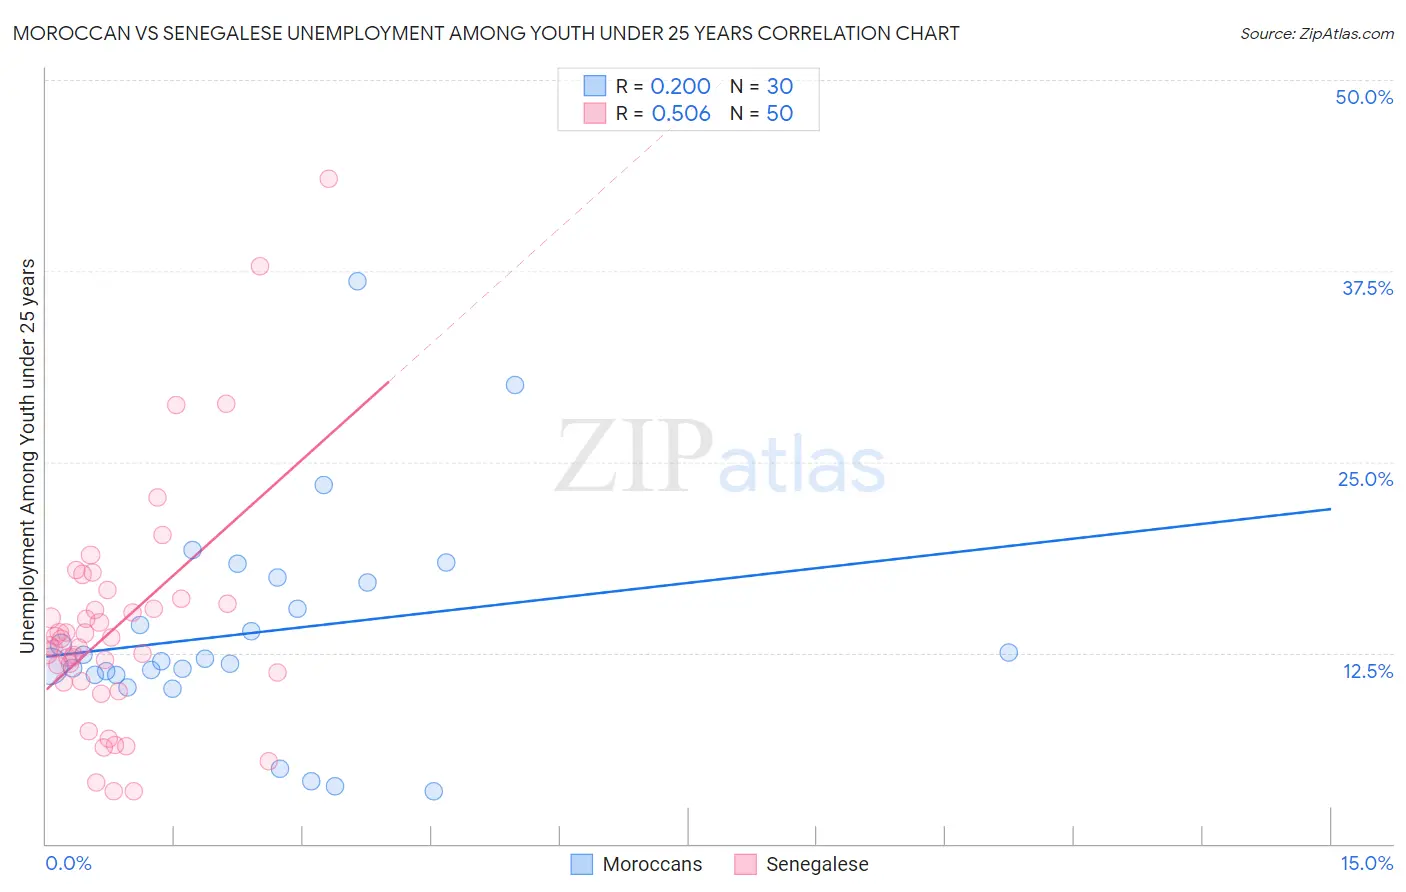
Moroccan vs Senegalese Unemployment Among Youth under 25 years Correlation Chart
The statistical analysis conducted on geographies consisting of 200,874,435 people shows a poor positive correlation between the proportion of Moroccans and unemployment rate among youth under the age of 25 in the United States with a correlation coefficient (R) of 0.200 and weighted average of 12.1%. Similarly, the statistical analysis conducted on geographies consisting of 78,068,880 people shows a substantial positive correlation between the proportion of Senegalese and unemployment rate among youth under the age of 25 in the United States with a correlation coefficient (R) of 0.506 and weighted average of 13.5%, a difference of 12.2%.
Unemployment Among Youth under 25 years Correlation Summary
| Measurement | Moroccan | Senegalese |
| Minimum | 3.4% | 3.4% |
| Maximum | 36.8% | 43.5% |
| Range | 33.4% | 40.1% |
| Mean | 13.8% | 14.2% |
| Median | 12.1% | 13.2% |
| Interquartile 25% (IQ1) | 11.1% | 10.7% |
| Interquartile 75% (IQ3) | 17.1% | 15.7% |
| Interquartile Range (IQR) | 6.0% | 5.0% |
| Standard Deviation (Sample) | 7.1% | 7.6% |
| Standard Deviation (Population) | 7.0% | 7.5% |
Similar Demographics by Unemployment Among Youth under 25 years
Demographics Similar to Moroccans by Unemployment Among Youth under 25 years
In terms of unemployment among youth under 25 years, the demographic groups most similar to Moroccans are Immigrants from Fiji (12.1%, a difference of 0.010%), Choctaw (12.1%, a difference of 0.050%), Immigrants from South America (12.1%, a difference of 0.15%), Immigrants from Belarus (12.1%, a difference of 0.23%), and Immigrants from Iran (12.0%, a difference of 0.24%).
| Demographics | Rating | Rank | Unemployment Among Youth under 25 years |
| Israelis | 4.1 /100 | #222 | Tragic 12.0% |
| Immigrants | Ireland | 3.5 /100 | #223 | Tragic 12.0% |
| Hawaiians | 3.5 /100 | #224 | Tragic 12.0% |
| Immigrants | Ukraine | 3.0 /100 | #225 | Tragic 12.0% |
| Immigrants | Israel | 2.6 /100 | #226 | Tragic 12.0% |
| Immigrants | Iran | 2.6 /100 | #227 | Tragic 12.0% |
| Immigrants | Fiji | 2.1 /100 | #228 | Tragic 12.1% |
| Moroccans | 2.1 /100 | #229 | Tragic 12.1% |
| Choctaw | 1.9 /100 | #230 | Tragic 12.1% |
| Immigrants | South America | 1.8 /100 | #231 | Tragic 12.1% |
| Immigrants | Belarus | 1.6 /100 | #232 | Tragic 12.1% |
| South American Indians | 1.6 /100 | #233 | Tragic 12.1% |
| Guatemalans | 1.4 /100 | #234 | Tragic 12.1% |
| Immigrants | Guatemala | 1.4 /100 | #235 | Tragic 12.1% |
| Immigrants | Immigrants | 1.3 /100 | #236 | Tragic 12.1% |
Demographics Similar to Senegalese by Unemployment Among Youth under 25 years
In terms of unemployment among youth under 25 years, the demographic groups most similar to Senegalese are Chippewa (13.5%, a difference of 0.020%), Immigrants from Caribbean (13.5%, a difference of 0.26%), Spanish American Indian (13.5%, a difference of 0.43%), Central American Indian (13.5%, a difference of 0.54%), and Apache (13.5%, a difference of 0.57%).
| Demographics | Rating | Rank | Unemployment Among Youth under 25 years |
| Immigrants | Ghana | 0.0 /100 | #289 | Tragic 13.4% |
| Immigrants | Ecuador | 0.0 /100 | #290 | Tragic 13.4% |
| Apache | 0.0 /100 | #291 | Tragic 13.5% |
| Central American Indians | 0.0 /100 | #292 | Tragic 13.5% |
| Spanish American Indians | 0.0 /100 | #293 | Tragic 13.5% |
| Immigrants | Caribbean | 0.0 /100 | #294 | Tragic 13.5% |
| Chippewa | 0.0 /100 | #295 | Tragic 13.5% |
| Senegalese | 0.0 /100 | #296 | Tragic 13.5% |
| U.S. Virgin Islanders | 0.0 /100 | #297 | Tragic 13.6% |
| Shoshone | 0.0 /100 | #298 | Tragic 13.7% |
| Tohono O'odham | 0.0 /100 | #299 | Tragic 13.8% |
| Immigrants | Cabo Verde | 0.0 /100 | #300 | Tragic 13.8% |
| Immigrants | Senegal | 0.0 /100 | #301 | Tragic 13.8% |
| Immigrants | Sierra Leone | 0.0 /100 | #302 | Tragic 13.8% |
| Belizeans | 0.0 /100 | #303 | Tragic 13.8% |