Bahamian vs Senegalese Unemployment Among Youth under 25 years
COMPARE
Bahamian
Senegalese
Unemployment Among Youth under 25 years
Unemployment Among Youth under 25 years Comparison
Bahamians
Senegalese
13.1%
UNEMPLOYMENT AMONG YOUTH UNDER 25 YEARS
0.0/ 100
METRIC RATING
277th/ 347
METRIC RANK
13.5%
UNEMPLOYMENT AMONG YOUTH UNDER 25 YEARS
0.0/ 100
METRIC RATING
296th/ 347
METRIC RANK
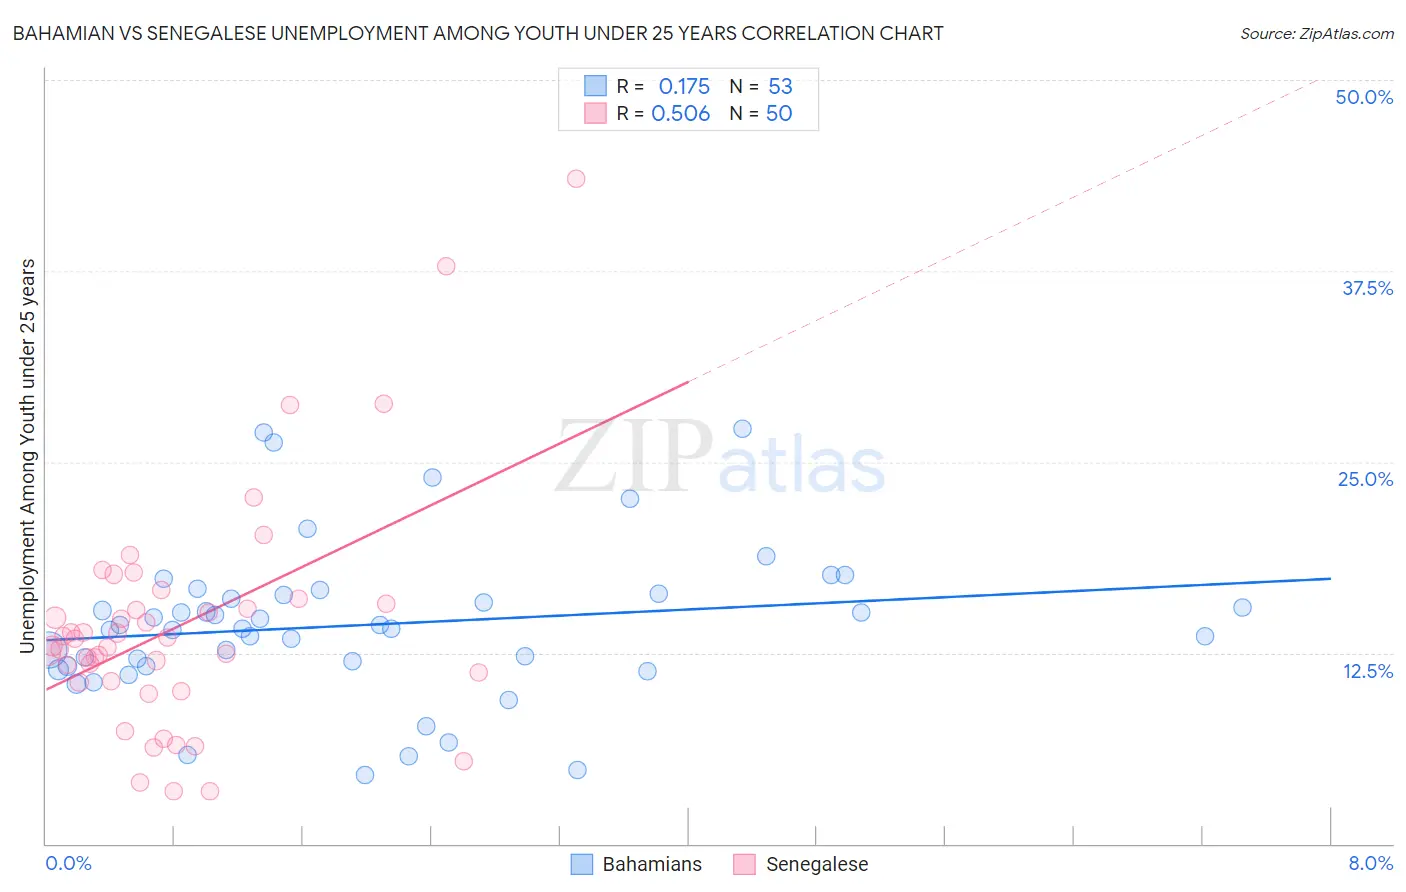
Bahamian vs Senegalese Unemployment Among Youth under 25 years Correlation Chart
The statistical analysis conducted on geographies consisting of 112,437,072 people shows a poor positive correlation between the proportion of Bahamians and unemployment rate among youth under the age of 25 in the United States with a correlation coefficient (R) of 0.175 and weighted average of 13.1%. Similarly, the statistical analysis conducted on geographies consisting of 78,068,880 people shows a substantial positive correlation between the proportion of Senegalese and unemployment rate among youth under the age of 25 in the United States with a correlation coefficient (R) of 0.506 and weighted average of 13.5%, a difference of 3.1%.
Unemployment Among Youth under 25 years Correlation Summary
| Measurement | Bahamian | Senegalese |
| Minimum | 4.5% | 3.4% |
| Maximum | 27.2% | 43.5% |
| Range | 22.7% | 40.1% |
| Mean | 14.3% | 14.2% |
| Median | 14.1% | 13.2% |
| Interquartile 25% (IQ1) | 11.6% | 10.7% |
| Interquartile 75% (IQ3) | 16.3% | 15.7% |
| Interquartile Range (IQR) | 4.7% | 5.0% |
| Standard Deviation (Sample) | 5.0% | 7.6% |
| Standard Deviation (Population) | 5.0% | 7.5% |
Demographics Similar to Bahamians and Senegalese by Unemployment Among Youth under 25 years
In terms of unemployment among youth under 25 years, the demographic groups most similar to Bahamians are Immigrants from Uzbekistan (13.1%, a difference of 0.17%), African (13.2%, a difference of 0.26%), Cajun (13.2%, a difference of 0.92%), Ute (13.3%, a difference of 1.2%), and Armenian (13.3%, a difference of 1.2%). Similarly, the demographic groups most similar to Senegalese are Chippewa (13.5%, a difference of 0.020%), Immigrants from Caribbean (13.5%, a difference of 0.26%), Spanish American Indian (13.5%, a difference of 0.43%), Central American Indian (13.5%, a difference of 0.54%), and Apache (13.5%, a difference of 0.57%).
| Demographics | Rating | Rank | Unemployment Among Youth under 25 years |
| Immigrants | Uzbekistan | 0.0 /100 | #276 | Tragic 13.1% |
| Bahamians | 0.0 /100 | #277 | Tragic 13.1% |
| Africans | 0.0 /100 | #278 | Tragic 13.2% |
| Cajuns | 0.0 /100 | #279 | Tragic 13.2% |
| Ute | 0.0 /100 | #280 | Tragic 13.3% |
| Armenians | 0.0 /100 | #281 | Tragic 13.3% |
| Sierra Leoneans | 0.0 /100 | #282 | Tragic 13.3% |
| Immigrants | Cameroon | 0.0 /100 | #283 | Tragic 13.3% |
| Lumbee | 0.0 /100 | #284 | Tragic 13.3% |
| Ghanaians | 0.0 /100 | #285 | Tragic 13.3% |
| Blackfeet | 0.0 /100 | #286 | Tragic 13.3% |
| Ecuadorians | 0.0 /100 | #287 | Tragic 13.3% |
| Immigrants | Western Africa | 0.0 /100 | #288 | Tragic 13.4% |
| Immigrants | Ghana | 0.0 /100 | #289 | Tragic 13.4% |
| Immigrants | Ecuador | 0.0 /100 | #290 | Tragic 13.4% |
| Apache | 0.0 /100 | #291 | Tragic 13.5% |
| Central American Indians | 0.0 /100 | #292 | Tragic 13.5% |
| Spanish American Indians | 0.0 /100 | #293 | Tragic 13.5% |
| Immigrants | Caribbean | 0.0 /100 | #294 | Tragic 13.5% |
| Chippewa | 0.0 /100 | #295 | Tragic 13.5% |
| Senegalese | 0.0 /100 | #296 | Tragic 13.5% |