Cheyenne vs Senegalese Unemployment Among Youth under 25 years
COMPARE
Cheyenne
Senegalese
Unemployment Among Youth under 25 years
Unemployment Among Youth under 25 years Comparison
Cheyenne
Senegalese
14.6%
UNEMPLOYMENT AMONG YOUTH UNDER 25 YEARS
0.0/ 100
METRIC RATING
321st/ 347
METRIC RANK
13.5%
UNEMPLOYMENT AMONG YOUTH UNDER 25 YEARS
0.0/ 100
METRIC RATING
296th/ 347
METRIC RANK
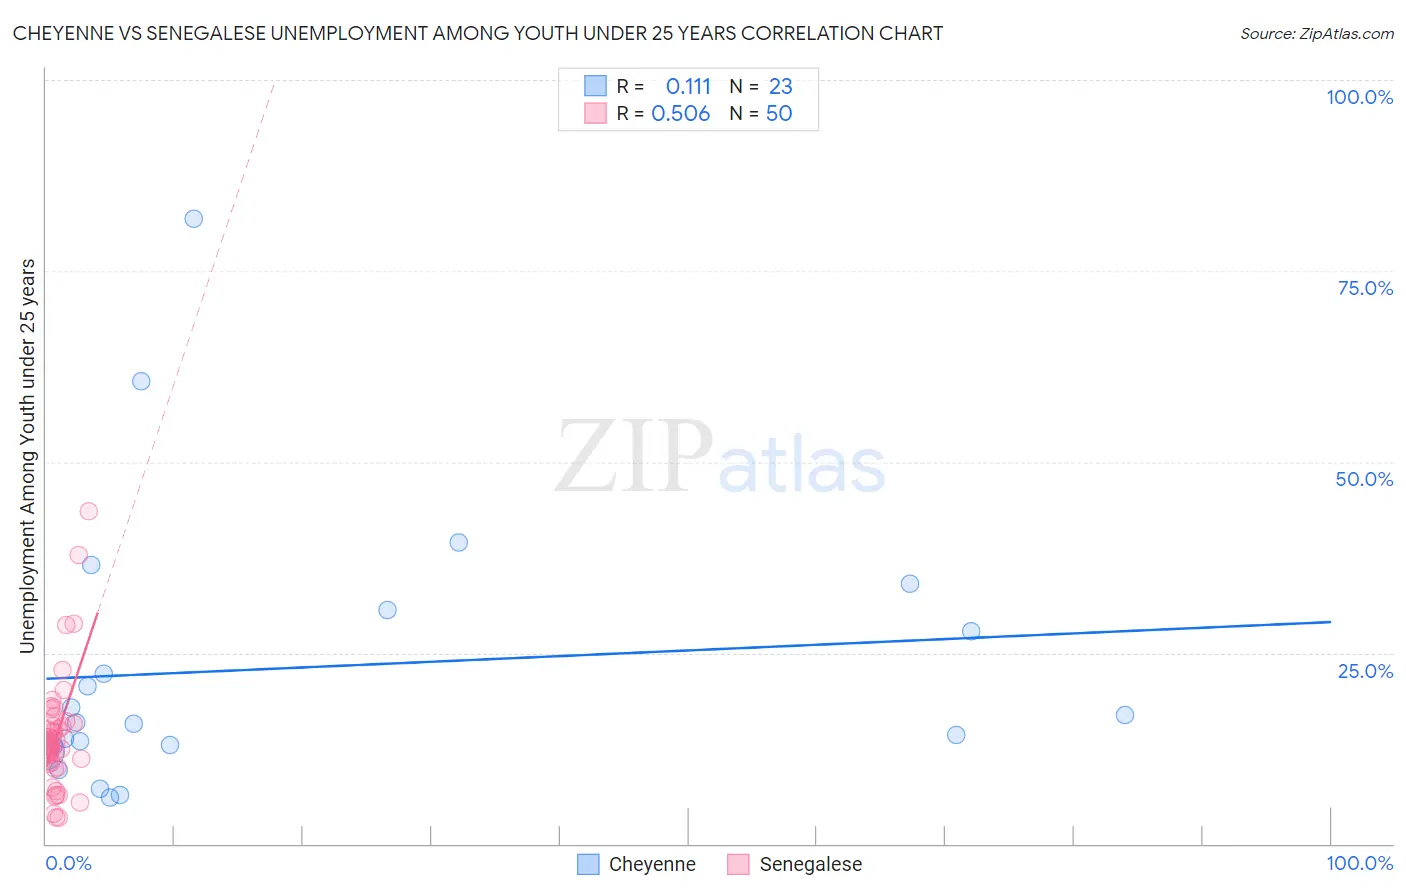
Cheyenne vs Senegalese Unemployment Among Youth under 25 years Correlation Chart
The statistical analysis conducted on geographies consisting of 80,351,634 people shows a poor positive correlation between the proportion of Cheyenne and unemployment rate among youth under the age of 25 in the United States with a correlation coefficient (R) of 0.111 and weighted average of 14.6%. Similarly, the statistical analysis conducted on geographies consisting of 78,068,880 people shows a substantial positive correlation between the proportion of Senegalese and unemployment rate among youth under the age of 25 in the United States with a correlation coefficient (R) of 0.506 and weighted average of 13.5%, a difference of 8.0%.
Unemployment Among Youth under 25 years Correlation Summary
| Measurement | Cheyenne | Senegalese |
| Minimum | 6.1% | 3.4% |
| Maximum | 81.8% | 43.5% |
| Range | 75.7% | 40.1% |
| Mean | 23.0% | 14.2% |
| Median | 15.9% | 13.2% |
| Interquartile 25% (IQ1) | 12.8% | 10.7% |
| Interquartile 75% (IQ3) | 30.6% | 15.7% |
| Interquartile Range (IQR) | 17.8% | 5.0% |
| Standard Deviation (Sample) | 18.2% | 7.6% |
| Standard Deviation (Population) | 17.8% | 7.5% |
Similar Demographics by Unemployment Among Youth under 25 years
Demographics Similar to Cheyenne by Unemployment Among Youth under 25 years
In terms of unemployment among youth under 25 years, the demographic groups most similar to Cheyenne are Trinidadian and Tobagonian (14.6%, a difference of 0.070%), Barbadian (14.6%, a difference of 0.16%), Immigrants from Trinidad and Tobago (14.6%, a difference of 0.16%), West Indian (14.6%, a difference of 0.20%), and Immigrants from Dominica (14.6%, a difference of 0.24%).
| Demographics | Rating | Rank | Unemployment Among Youth under 25 years |
| Jamaicans | 0.0 /100 | #314 | Tragic 14.4% |
| Sioux | 0.0 /100 | #315 | Tragic 14.4% |
| Natives/Alaskans | 0.0 /100 | #316 | Tragic 14.5% |
| Blacks/African Americans | 0.0 /100 | #317 | Tragic 14.5% |
| Immigrants | Dominica | 0.0 /100 | #318 | Tragic 14.6% |
| West Indians | 0.0 /100 | #319 | Tragic 14.6% |
| Barbadians | 0.0 /100 | #320 | Tragic 14.6% |
| Cheyenne | 0.0 /100 | #321 | Tragic 14.6% |
| Trinidadians and Tobagonians | 0.0 /100 | #322 | Tragic 14.6% |
| Immigrants | Trinidad and Tobago | 0.0 /100 | #323 | Tragic 14.6% |
| Immigrants | Jamaica | 0.0 /100 | #324 | Tragic 14.8% |
| Alaska Natives | 0.0 /100 | #325 | Tragic 14.9% |
| Immigrants | Barbados | 0.0 /100 | #326 | Tragic 15.2% |
| British West Indians | 0.0 /100 | #327 | Tragic 15.5% |
| Immigrants | Dominican Republic | 0.0 /100 | #328 | Tragic 15.6% |
Demographics Similar to Senegalese by Unemployment Among Youth under 25 years
In terms of unemployment among youth under 25 years, the demographic groups most similar to Senegalese are Chippewa (13.5%, a difference of 0.020%), Immigrants from Caribbean (13.5%, a difference of 0.26%), Spanish American Indian (13.5%, a difference of 0.43%), Central American Indian (13.5%, a difference of 0.54%), and Apache (13.5%, a difference of 0.57%).
| Demographics | Rating | Rank | Unemployment Among Youth under 25 years |
| Immigrants | Ghana | 0.0 /100 | #289 | Tragic 13.4% |
| Immigrants | Ecuador | 0.0 /100 | #290 | Tragic 13.4% |
| Apache | 0.0 /100 | #291 | Tragic 13.5% |
| Central American Indians | 0.0 /100 | #292 | Tragic 13.5% |
| Spanish American Indians | 0.0 /100 | #293 | Tragic 13.5% |
| Immigrants | Caribbean | 0.0 /100 | #294 | Tragic 13.5% |
| Chippewa | 0.0 /100 | #295 | Tragic 13.5% |
| Senegalese | 0.0 /100 | #296 | Tragic 13.5% |
| U.S. Virgin Islanders | 0.0 /100 | #297 | Tragic 13.6% |
| Shoshone | 0.0 /100 | #298 | Tragic 13.7% |
| Tohono O'odham | 0.0 /100 | #299 | Tragic 13.8% |
| Immigrants | Cabo Verde | 0.0 /100 | #300 | Tragic 13.8% |
| Immigrants | Senegal | 0.0 /100 | #301 | Tragic 13.8% |
| Immigrants | Sierra Leone | 0.0 /100 | #302 | Tragic 13.8% |
| Belizeans | 0.0 /100 | #303 | Tragic 13.8% |