Maltese vs Dutch West Indian Unemployment Among Women with Children Ages 6 to 17 years
COMPARE
Maltese
Dutch West Indian
Unemployment Among Women with Children Ages 6 to 17 years
Unemployment Among Women with Children Ages 6 to 17 years Comparison
Maltese
Dutch West Indians
9.1%
UNEMPLOYMENT AMONG WOMEN WITH CHILDREN AGES 6 TO 17 YEARS
15.3/ 100
METRIC RATING
203rd/ 347
METRIC RANK
10.2%
UNEMPLOYMENT AMONG WOMEN WITH CHILDREN AGES 6 TO 17 YEARS
0.0/ 100
METRIC RATING
308th/ 347
METRIC RANK
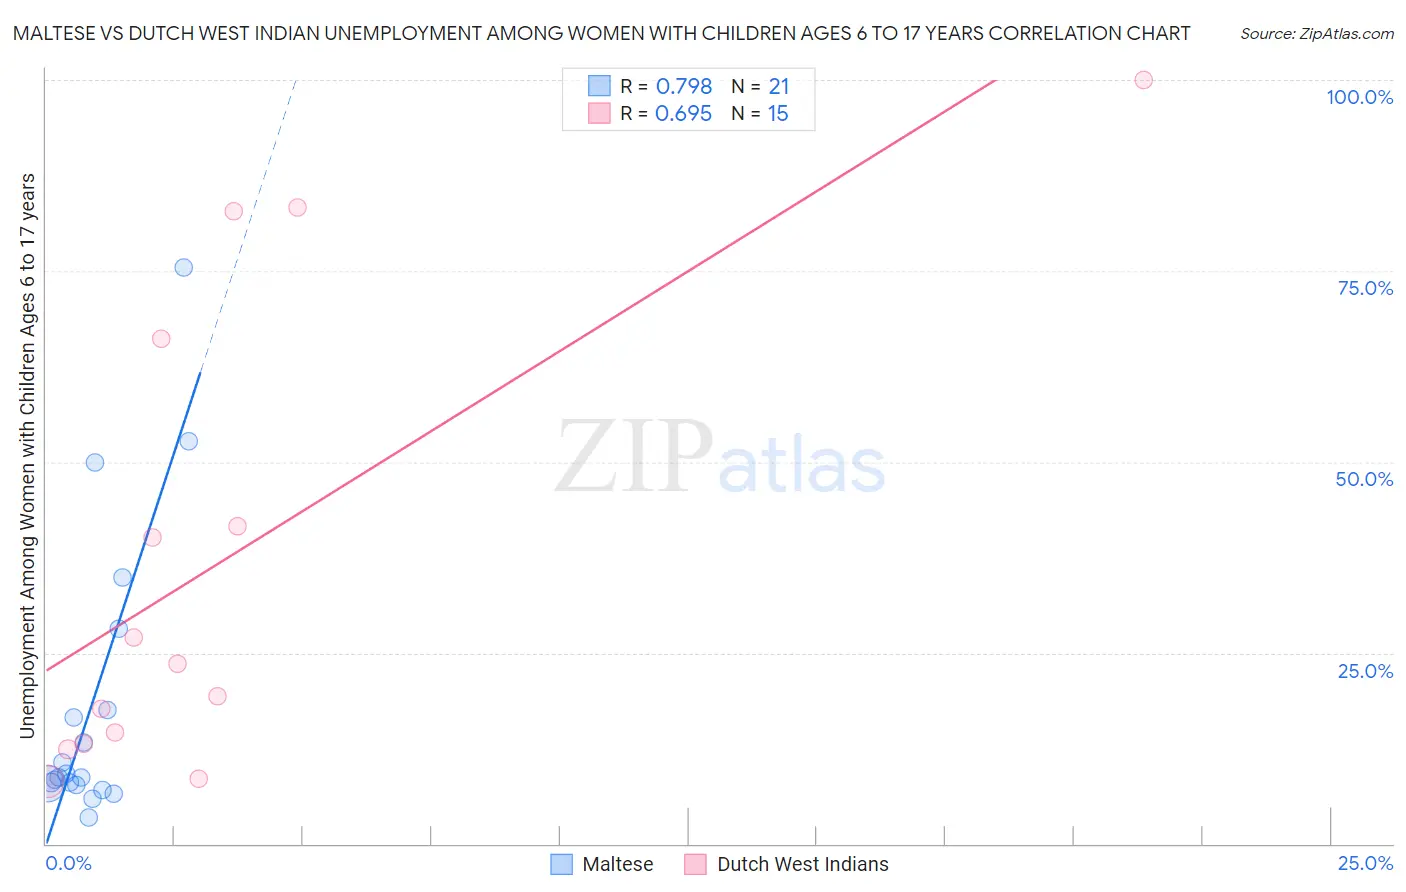
Maltese vs Dutch West Indian Unemployment Among Women with Children Ages 6 to 17 years Correlation Chart
The statistical analysis conducted on geographies consisting of 103,583,080 people shows a strong positive correlation between the proportion of Maltese and unemployment rate among women with children between the ages 6 and 17 in the United States with a correlation coefficient (R) of 0.798 and weighted average of 9.1%. Similarly, the statistical analysis conducted on geographies consisting of 73,777,912 people shows a significant positive correlation between the proportion of Dutch West Indians and unemployment rate among women with children between the ages 6 and 17 in the United States with a correlation coefficient (R) of 0.695 and weighted average of 10.2%, a difference of 12.2%.
Unemployment Among Women with Children Ages 6 to 17 years Correlation Summary
| Measurement | Maltese | Dutch West Indian |
| Minimum | 3.5% | 8.2% |
| Maximum | 75.5% | 100.0% |
| Range | 72.0% | 91.8% |
| Mean | 18.5% | 37.2% |
| Median | 8.7% | 23.6% |
| Interquartile 25% (IQ1) | 7.8% | 13.0% |
| Interquartile 75% (IQ3) | 22.8% | 66.1% |
| Interquartile Range (IQR) | 15.1% | 53.1% |
| Standard Deviation (Sample) | 19.2% | 30.9% |
| Standard Deviation (Population) | 18.7% | 29.9% |
Similar Demographics by Unemployment Among Women with Children Ages 6 to 17 years
Demographics Similar to Maltese by Unemployment Among Women with Children Ages 6 to 17 years
In terms of unemployment among women with children ages 6 to 17 years, the demographic groups most similar to Maltese are Immigrants from Canada (9.1%, a difference of 0.0%), Immigrants from Middle Africa (9.1%, a difference of 0.020%), Immigrants from Trinidad and Tobago (9.1%, a difference of 0.11%), Immigrants from Western Europe (9.1%, a difference of 0.11%), and Trinidadian and Tobagonian (9.1%, a difference of 0.22%).
| Demographics | Rating | Rank | Unemployment Among Women with Children Ages 6 to 17 years |
| Brazilians | 24.4 /100 | #196 | Fair 9.1% |
| Immigrants | Panama | 24.3 /100 | #197 | Fair 9.1% |
| Guyanese | 21.8 /100 | #198 | Fair 9.1% |
| Czechoslovakians | 20.8 /100 | #199 | Fair 9.1% |
| Trinidadians and Tobagonians | 18.2 /100 | #200 | Poor 9.1% |
| Immigrants | Trinidad and Tobago | 16.7 /100 | #201 | Poor 9.1% |
| Immigrants | Middle Africa | 15.6 /100 | #202 | Poor 9.1% |
| Maltese | 15.3 /100 | #203 | Poor 9.1% |
| Immigrants | Canada | 15.3 /100 | #204 | Poor 9.1% |
| Immigrants | Western Europe | 14.1 /100 | #205 | Poor 9.1% |
| Immigrants | North America | 12.7 /100 | #206 | Poor 9.2% |
| Cubans | 10.9 /100 | #207 | Poor 9.2% |
| Immigrants | Peru | 10.8 /100 | #208 | Poor 9.2% |
| Salvadorans | 10.7 /100 | #209 | Poor 9.2% |
| Finns | 10.0 /100 | #210 | Tragic 9.2% |
Demographics Similar to Dutch West Indians by Unemployment Among Women with Children Ages 6 to 17 years
In terms of unemployment among women with children ages 6 to 17 years, the demographic groups most similar to Dutch West Indians are Immigrants from Senegal (10.2%, a difference of 0.010%), Paraguayan (10.2%, a difference of 0.24%), Immigrants from Nigeria (10.2%, a difference of 0.53%), French Canadian (10.3%, a difference of 0.54%), and Immigrants from Venezuela (10.2%, a difference of 0.59%).
| Demographics | Rating | Rank | Unemployment Among Women with Children Ages 6 to 17 years |
| Immigrants | Bahamas | 0.0 /100 | #301 | Tragic 10.1% |
| Venezuelans | 0.0 /100 | #302 | Tragic 10.2% |
| Immigrants | Ecuador | 0.0 /100 | #303 | Tragic 10.2% |
| Immigrants | Venezuela | 0.0 /100 | #304 | Tragic 10.2% |
| Immigrants | Nigeria | 0.0 /100 | #305 | Tragic 10.2% |
| Paraguayans | 0.0 /100 | #306 | Tragic 10.2% |
| Immigrants | Senegal | 0.0 /100 | #307 | Tragic 10.2% |
| Dutch West Indians | 0.0 /100 | #308 | Tragic 10.2% |
| French Canadians | 0.0 /100 | #309 | Tragic 10.3% |
| Alaska Natives | 0.0 /100 | #310 | Tragic 10.3% |
| Immigrants | Liberia | 0.0 /100 | #311 | Tragic 10.3% |
| Africans | 0.0 /100 | #312 | Tragic 10.4% |
| Americans | 0.0 /100 | #313 | Tragic 10.4% |
| Immigrants | Cabo Verde | 0.0 /100 | #314 | Tragic 10.4% |
| Bahamians | 0.0 /100 | #315 | Tragic 10.4% |