Luxembourger vs Yakama Female Unemployment
COMPARE
Luxembourger
Yakama
Female Unemployment
Female Unemployment Comparison
Luxembourgers
Yakama
4.4%
FEMALE UNEMPLOYMENT
100.0/ 100
METRIC RATING
3rd/ 347
METRIC RANK
6.7%
FEMALE UNEMPLOYMENT
0.0/ 100
METRIC RATING
330th/ 347
METRIC RANK
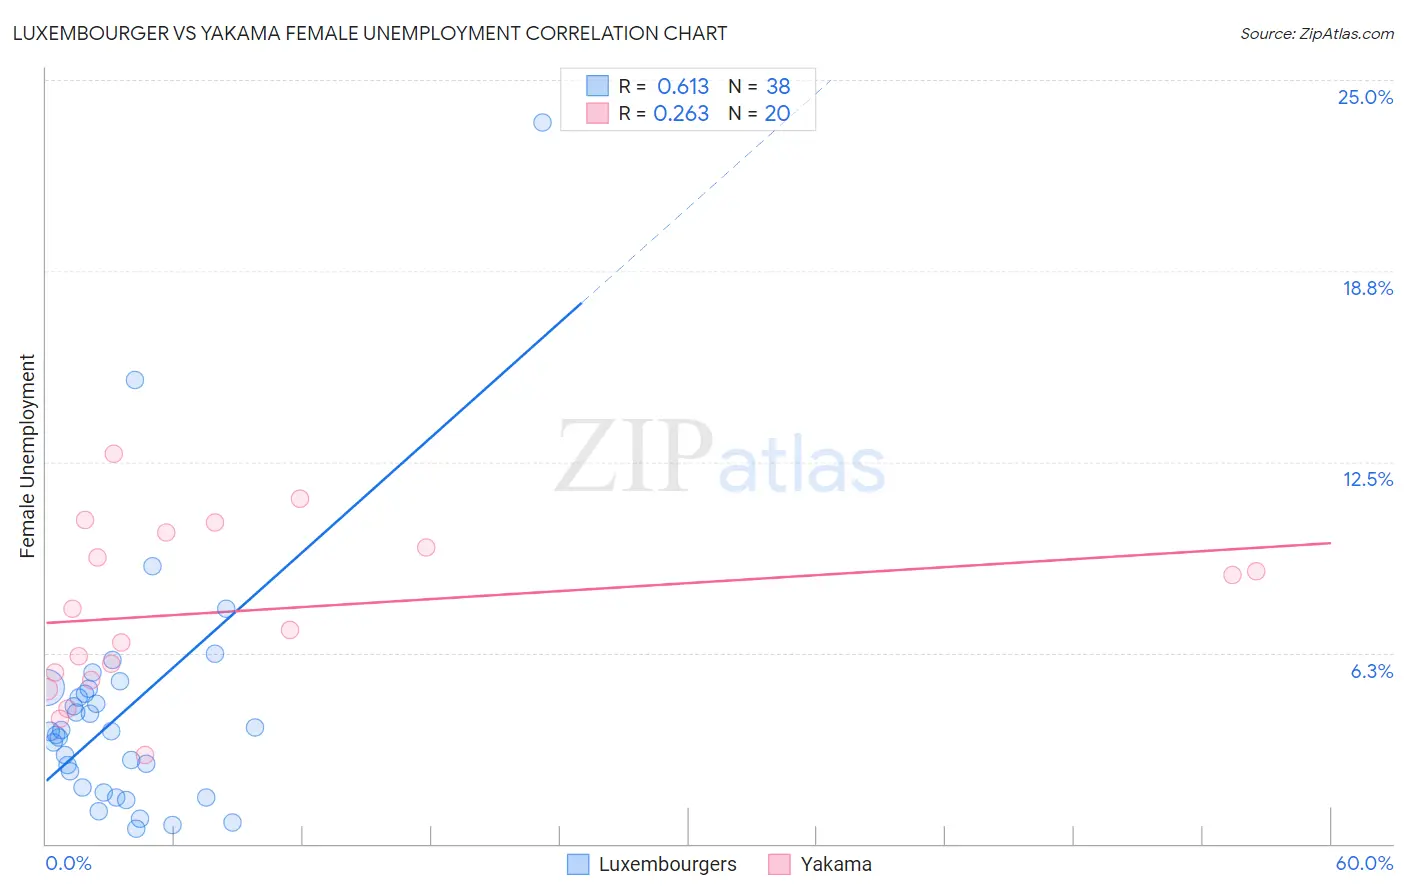
Luxembourger vs Yakama Female Unemployment Correlation Chart
The statistical analysis conducted on geographies consisting of 144,033,637 people shows a significant positive correlation between the proportion of Luxembourgers and unemploymnet rate among females in the United States with a correlation coefficient (R) of 0.613 and weighted average of 4.4%. Similarly, the statistical analysis conducted on geographies consisting of 19,884,840 people shows a weak positive correlation between the proportion of Yakama and unemploymnet rate among females in the United States with a correlation coefficient (R) of 0.263 and weighted average of 6.7%, a difference of 53.2%.
Female Unemployment Correlation Summary
| Measurement | Luxembourger | Yakama |
| Minimum | 0.50% | 2.9% |
| Maximum | 23.6% | 12.8% |
| Range | 23.1% | 9.9% |
| Mean | 4.4% | 7.6% |
| Median | 3.7% | 7.4% |
| Interquartile 25% (IQ1) | 1.8% | 5.5% |
| Interquartile 75% (IQ3) | 5.1% | 9.9% |
| Interquartile Range (IQR) | 3.2% | 4.5% |
| Standard Deviation (Sample) | 4.2% | 2.7% |
| Standard Deviation (Population) | 4.2% | 2.7% |
Similar Demographics by Female Unemployment
Demographics Similar to Luxembourgers by Female Unemployment
In terms of female unemployment, the demographic groups most similar to Luxembourgers are Czech (4.4%, a difference of 0.010%), Danish (4.4%, a difference of 0.030%), Hmong (4.4%, a difference of 0.14%), Swedish (4.4%, a difference of 1.4%), and Chinese (4.5%, a difference of 2.2%).
| Demographics | Rating | Rank | Female Unemployment |
| Norwegians | 100.0 /100 | #1 | Exceptional 4.2% |
| Czechs | 100.0 /100 | #2 | Exceptional 4.4% |
| Luxembourgers | 100.0 /100 | #3 | Exceptional 4.4% |
| Danes | 100.0 /100 | #4 | Exceptional 4.4% |
| Hmong | 100.0 /100 | #5 | Exceptional 4.4% |
| Swedes | 100.0 /100 | #6 | Exceptional 4.4% |
| Chinese | 100.0 /100 | #7 | Exceptional 4.5% |
| Germans | 100.0 /100 | #8 | Exceptional 4.5% |
| Slovenes | 100.0 /100 | #9 | Exceptional 4.5% |
| Swiss | 100.0 /100 | #10 | Exceptional 4.6% |
| Scandinavians | 100.0 /100 | #11 | Exceptional 4.6% |
| Dutch | 100.0 /100 | #12 | Exceptional 4.6% |
| Belgians | 100.0 /100 | #13 | Exceptional 4.6% |
| Finns | 100.0 /100 | #14 | Exceptional 4.6% |
| English | 100.0 /100 | #15 | Exceptional 4.6% |
Demographics Similar to Yakama by Female Unemployment
In terms of female unemployment, the demographic groups most similar to Yakama are Immigrants from Guyana (6.7%, a difference of 0.57%), Guyanese (6.7%, a difference of 0.94%), Paiute (6.8%, a difference of 1.1%), Alaska Native (6.6%, a difference of 1.4%), and Native/Alaskan (6.6%, a difference of 1.5%).
| Demographics | Rating | Rank | Female Unemployment |
| Immigrants | Belize | 0.0 /100 | #323 | Tragic 6.5% |
| Cheyenne | 0.0 /100 | #324 | Tragic 6.6% |
| Apache | 0.0 /100 | #325 | Tragic 6.6% |
| Natives/Alaskans | 0.0 /100 | #326 | Tragic 6.6% |
| Alaska Natives | 0.0 /100 | #327 | Tragic 6.6% |
| Guyanese | 0.0 /100 | #328 | Tragic 6.7% |
| Immigrants | Guyana | 0.0 /100 | #329 | Tragic 6.7% |
| Yakama | 0.0 /100 | #330 | Tragic 6.7% |
| Paiute | 0.0 /100 | #331 | Tragic 6.8% |
| Sioux | 0.0 /100 | #332 | Tragic 7.0% |
| Menominee | 0.0 /100 | #333 | Tragic 7.0% |
| Immigrants | Armenia | 0.0 /100 | #334 | Tragic 7.1% |
| Dominicans | 0.0 /100 | #335 | Tragic 7.2% |
| Immigrants | Dominican Republic | 0.0 /100 | #336 | Tragic 7.2% |
| Navajo | 0.0 /100 | #337 | Tragic 7.3% |