Lebanese vs Immigrants from Central America Male Unemployment

COMPARE

Lebanese
Race
Ancestry
AfghanAfricanAlaska NativeAlaskan AthabascanAlbanianAleutAlsatianAmericanApacheArabArapahoArgentineanArmenianAssyrian/Chaldean/SyriacAustralianAustrianBahamianBangladeshiBarbadianBasqueBelgianBelizeanBermudanBhutaneseBlackfeetBolivianBrazilianBritishBritish West IndianBulgarianBurmeseCajunCambodianCanadianCape VerdeanCarpatho RusynCelticCentral AmericanCentral American IndianCherokeeCheyenneChickasawChileanChineseChippewaChoctawColombianColvilleComancheCosta RicanCreeCreekCroatianCrowCubanCypriotCzechCzechoslovakianDanishDelawareDominicanDutchDutch West IndianEastern EuropeanEcuadorianEgyptianEnglishEstonianEthiopianEuropeanFijianFilipinoFinnishFrenchFrench American IndianFrench CanadianGermanGerman RussianGhanaianGreekGuamanian/ChamorroGuatemalanGuyaneseHaitianHmongHonduranHopiHoumaHungarianIcelanderIndian (Asian)IndonesianInupiatIranianIraqiIrishIroquoisIsraeliItalianJamaicanJapaneseJordanianKenyanKiowaKoreanLaotianLatvianLebaneseLiberianLithuanianLumbeeLuxembourgerMacedonianMalaysianMalteseMarshalleseMenomineeMexicanMexican American IndianMongolianMoroccanNative HawaiianNavajoNepaleseNew ZealanderNicaraguanNigerianNorthern EuropeanNorwegianOkinawanOsageOttawaPaiutePakistaniPalestinianPanamanianParaguayanPennsylvania GermanPeruvianPimaPolishPortuguesePotawatomiPuebloPuerto RicanPuget Sound SalishRomanianRussianSalvadoranSamoanScandinavianScotch-IrishScottishSeminoleSenegaleseSerbianShoshoneSierra LeoneanSiouxSlavicSlovakSloveneSomaliSouth AfricanSouth AmericanSouth American IndianSoviet UnionSpaniardSpanishSpanish AmericanSpanish American IndianSri LankanSubsaharan AfricanSudaneseSwedishSwissSyrianTaiwaneseThaiTlingit-HaidaTohono O'OdhamTonganTrinidadian and TobagonianTsimshianTurkishU.S. Virgin IslanderUgandanUkrainianUruguayanUteVenezuelanVietnameseWelshWest IndianYakamaYaquiYugoslavianYumanYup'ikZimbabwean
Immigration
NonimmigrantsImmigrantsAfghanistanAfricaAlbaniaArgentinaArmeniaAsiaAustraliaAustriaBahamasBangladeshBarbadosBelarusBelgiumBelizeBoliviaBosnia and HerzegovinaBrazilBulgariaBurma/MyanmarCabo VerdeCambodiaCameroonCanadaCaribbeanChileChinaColombiaCongoCosta RicaCroatiaCubaCzechoslovakiaDenmarkDominicaDominican RepublicEastern AfricaEastern AsiaEastern EuropeEcuadorEgyptEl SalvadorEnglandEritreaEthiopiaEuropeFijiFranceGermanyGhanaGreeceGrenadaGuatemalaGuyanaHaitiHondurasHong KongHungaryIndiaIndonesiaIranIraqIrelandIsraelItalyJamaicaJapanJordanKazakhstanKenyaKoreaKuwaitLaosLatin AmericaLatviaLebanonLiberiaLithuaniaMalaysiaMexicoMicronesiaMiddle AfricaMoldovaMoroccoNepalNetherlandsNicaraguaNigeriaNorth AmericaNorth MacedoniaNorthern AfricaNorthern EuropeNorwayOceaniaPakistanPanamaPeruPhilippinesPolandPortugalRomaniaRussiaSaudi ArabiaScotlandSenegalSerbiaSierra LeoneSingaporeSomaliaSouth AfricaSouth AmericaSouth Central AsiaSouth Eastern AsiaSouthern EuropeSpainSri LankaSt. Vincent and the GrenadinesSudanSwedenSwitzerlandSyriaTaiwanThailandTrinidad and TobagoTurkeyUgandaUkraineUruguayUzbekistanVenezuelaVietnamWest IndiesWestern AfricaWestern AsiaWestern EuropeYemenZaireZimbabweAzores
Immigrants from Central America
Race
Ancestry
AfghanAfricanAlaska NativeAlaskan AthabascanAlbanianAleutAlsatianAmericanApacheArabArapahoArgentineanArmenianAssyrian/Chaldean/SyriacAustralianAustrianBahamianBangladeshiBarbadianBasqueBelgianBelizeanBermudanBhutaneseBlackfeetBolivianBrazilianBritishBritish West IndianBulgarianBurmeseCajunCambodianCanadianCape VerdeanCarpatho RusynCelticCentral AmericanCentral American IndianCherokeeCheyenneChickasawChileanChineseChippewaChoctawColombianColvilleComancheCosta RicanCreeCreekCroatianCrowCubanCypriotCzechCzechoslovakianDanishDelawareDominicanDutchDutch West IndianEastern EuropeanEcuadorianEgyptianEnglishEstonianEthiopianEuropeanFijianFilipinoFinnishFrenchFrench American IndianFrench CanadianGermanGerman RussianGhanaianGreekGuamanian/ChamorroGuatemalanGuyaneseHaitianHmongHonduranHopiHoumaHungarianIcelanderIndian (Asian)IndonesianInupiatIranianIraqiIrishIroquoisIsraeliItalianJamaicanJapaneseJordanianKenyanKiowaKoreanLaotianLatvianLiberianLithuanianLumbeeLuxembourgerMacedonianMalaysianMalteseMarshalleseMenomineeMexicanMexican American IndianMongolianMoroccanNative HawaiianNavajoNepaleseNew ZealanderNicaraguanNigerianNorthern EuropeanNorwegianOkinawanOsageOttawaPaiutePakistaniPalestinianPanamanianParaguayanPennsylvania GermanPeruvianPimaPolishPortuguesePotawatomiPuebloPuerto RicanPuget Sound SalishRomanianRussianSalvadoranSamoanScandinavianScotch-IrishScottishSeminoleSenegaleseSerbianShoshoneSierra LeoneanSiouxSlavicSlovakSloveneSomaliSouth AfricanSouth AmericanSouth American IndianSoviet UnionSpaniardSpanishSpanish AmericanSpanish American IndianSri LankanSubsaharan AfricanSudaneseSwedishSwissSyrianTaiwaneseThaiTlingit-HaidaTohono O'OdhamTonganTrinidadian and TobagonianTsimshianTurkishU.S. Virgin IslanderUgandanUkrainianUruguayanUteVenezuelanVietnameseWelshWest IndianYakamaYaquiYugoslavianYumanYup'ikZimbabwean
Immigration
NonimmigrantsImmigrantsAfghanistanAfricaAlbaniaArgentinaArmeniaAsiaAustraliaAustriaBahamasBangladeshBarbadosBelarusBelgiumBelizeBoliviaBosnia and HerzegovinaBrazilBulgariaBurma/MyanmarCabo VerdeCambodiaCameroonCanadaCaribbeanCentral AmericaChileChinaColombiaCongoCosta RicaCroatiaCubaCzechoslovakiaDenmarkDominicaDominican RepublicEastern AfricaEastern AsiaEastern EuropeEcuadorEgyptEl SalvadorEnglandEritreaEthiopiaEuropeFijiFranceGermanyGhanaGreeceGrenadaGuatemalaGuyanaHaitiHondurasHong KongHungaryIndiaIndonesiaIranIraqIrelandIsraelItalyJamaicaJapanJordanKazakhstanKenyaKoreaKuwaitLaosLatin AmericaLatviaLebanonLiberiaLithuaniaMalaysiaMexicoMicronesiaMiddle AfricaMoldovaMoroccoNepalNetherlandsNicaraguaNigeriaNorth AmericaNorth MacedoniaNorthern AfricaNorthern EuropeNorwayOceaniaPakistanPanamaPeruPhilippinesPolandPortugalRomaniaRussiaSaudi ArabiaScotlandSenegalSerbiaSierra LeoneSingaporeSomaliaSouth AfricaSouth AmericaSouth Central AsiaSouth Eastern AsiaSouthern EuropeSpainSri LankaSt. Vincent and the GrenadinesSudanSwedenSwitzerlandSyriaTaiwanThailandTrinidad and TobagoTurkeyUgandaUkraineUruguayUzbekistanVenezuelaVietnamWest IndiesWestern AfricaWestern AsiaWestern EuropeYemenZaireZimbabweAzores
Male Unemployment
Income
Poverty
Unemployment
Labor Participation
Family Structure
Vehicle Availability
Education Level
Disability

Male Unemployment Comparison

Lebanese

Immigrants from Central America

Good
Tragic
5.2%
MALE UNEMPLOYMENT
79.9/ 100
METRIC RATING
136th/ 347
METRIC RANK
5.8%
MALE UNEMPLOYMENT
0.1/ 100
METRIC RATING
260th/ 347
METRIC RANK

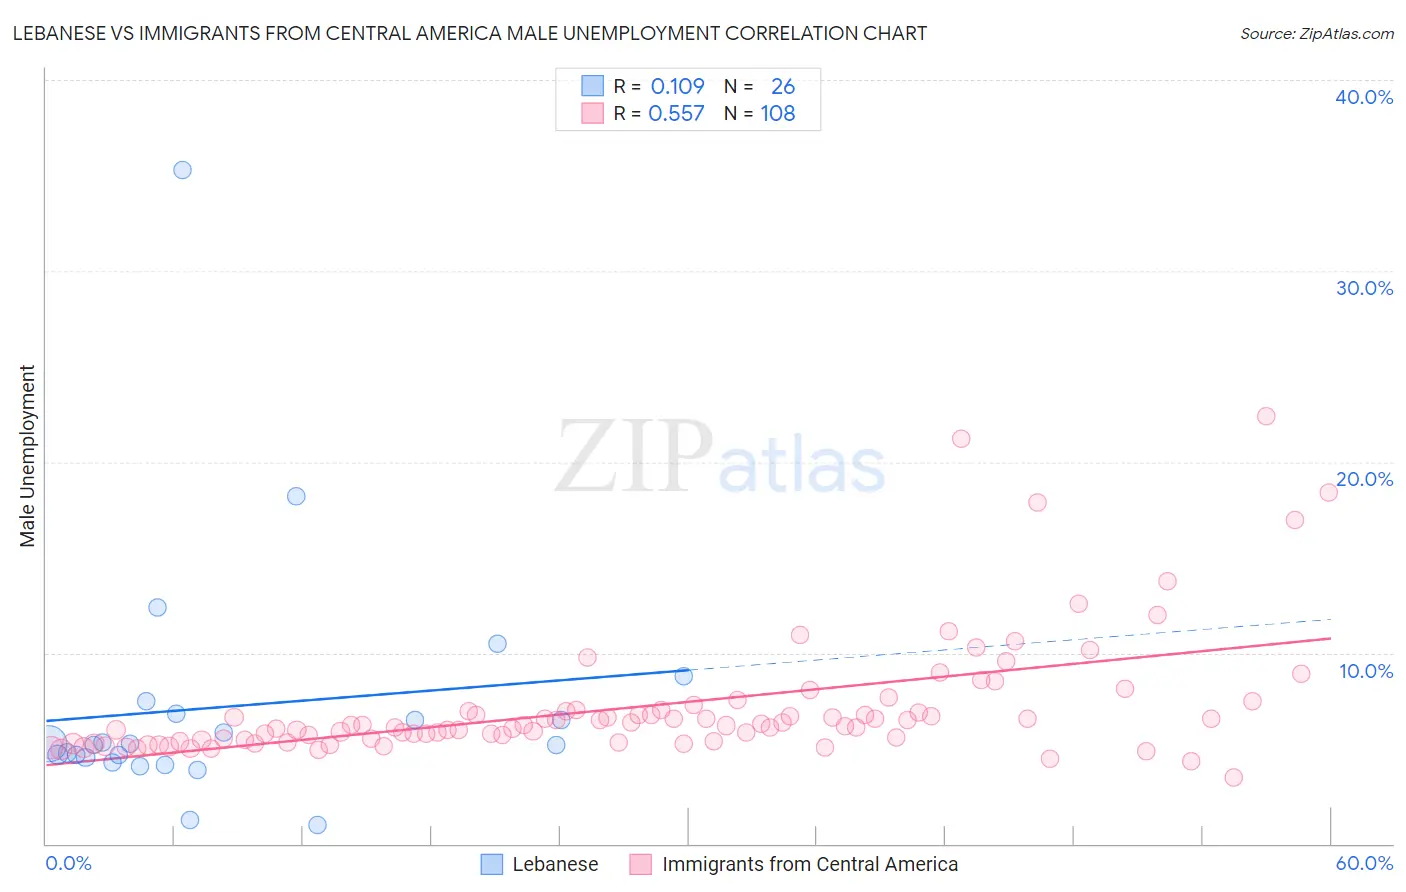
Lebanese vs Immigrants from Central America Male Unemployment Correlation Chart

The statistical analysis conducted on geographies consisting of 399,936,199 people shows a poor positive correlation between the proportion of Lebanese and unemployment rate among males in the United States with a correlation coefficient (R) of 0.109 and weighted average of 5.2%. Similarly, the statistical analysis conducted on geographies consisting of 529,817,546 people shows a substantial positive correlation between the proportion of Immigrants from Central America and unemployment rate among males in the United States with a correlation coefficient (R) of 0.557 and weighted average of 5.8%, a difference of 12.2%.
Lebanese vs Immigrants from Central America Male Unemployment

Male Unemployment Correlation Summary

MeasurementLebaneseImmigrants from Central America
Minimum1.0%3.5%
Maximum35.3%22.4%
Range34.3%18.9%
Mean7.2%7.2%
Median5.2%6.2%
Interquartile 25% (IQ1)4.5%5.4%
Interquartile 75% (IQ3)6.8%7.0%
Interquartile Range (IQR)2.2%1.6%
Standard Deviation (Sample)6.7%3.3%
Standard Deviation (Population)6.6%3.2%

Similar Demographics by Male Unemployment

Demographics Similar to Lebanese by Male Unemployment

In terms of male unemployment, the demographic groups most similar to Lebanese are Immigrants from Eastern Africa (5.2%, a difference of 0.010%), Immigrants from Saudi Arabia (5.2%, a difference of 0.020%), Immigrants from Croatia (5.2%, a difference of 0.020%), Kenyan (5.2%, a difference of 0.040%), and Pakistani (5.2%, a difference of 0.050%).
DemographicsRating | RankMale Unemployment
Immigrants | Western Europe
84.8
/100
|
#129
Excellent
5.2%
Immigrants | Malaysia
83.5
/100
|
#130
Excellent
5.2%
Immigrants | Germany
83.0
/100
|
#131
Excellent
5.2%
Chickasaw
82.9
/100
|
#132
Excellent
5.2%
Colombians
81.1
/100
|
#133
Excellent
5.2%
Pakistanis
80.5
/100
|
#134
Excellent
5.2%
Immigrants | Saudi Arabia
80.1
/100
|
#135
Excellent
5.2%
Lebanese
79.9
/100
|
#136
Good
5.2%
Immigrants | Eastern Africa
79.8
/100
|
#137
Good
5.2%
Immigrants | Croatia
79.7
/100
|
#138
Good
5.2%
Kenyans
79.4
/100
|
#139
Good
5.2%
Brazilians
79.3
/100
|
#140
Good
5.2%
Immigrants | Switzerland
79.2
/100
|
#141
Good
5.2%
Fijians
78.3
/100
|
#142
Good
5.2%
Syrians
78.0
/100
|
#143
Good
5.2%

Demographics Similar to Immigrants from Central America by Male Unemployment

In terms of male unemployment, the demographic groups most similar to Immigrants from Central America are Cajun (5.8%, a difference of 0.060%), Liberian (5.8%, a difference of 0.18%), Dutch West Indian (5.8%, a difference of 0.21%), Hispanic or Latino (5.8%, a difference of 0.35%), and Comanche (5.8%, a difference of 0.52%).
DemographicsRating | RankMale Unemployment
Mexican American Indians
0.2
/100
|
#253
Tragic
5.8%
Japanese
0.2
/100
|
#254
Tragic
5.8%
Kiowa
0.2
/100
|
#255
Tragic
5.8%
Comanche
0.2
/100
|
#256
Tragic
5.8%
Hispanics or Latinos
0.1
/100
|
#257
Tragic
5.8%
Dutch West Indians
0.1
/100
|
#258
Tragic
5.8%
Cajuns
0.1
/100
|
#259
Tragic
5.8%
Immigrants | Central America
0.1
/100
|
#260
Tragic
5.8%
Liberians
0.1
/100
|
#261
Tragic
5.8%
Immigrants | Portugal
0.1
/100
|
#262
Tragic
5.9%
Immigrants | Latin America
0.1
/100
|
#263
Tragic
5.9%
Immigrants | Mexico
0.0
/100
|
#264
Tragic
5.9%
French American Indians
0.0
/100
|
#265
Tragic
5.9%
Bahamians
0.0
/100
|
#266
Tragic
5.9%
Nigerians
0.0
/100
|
#267
Tragic
5.9%