Jordanian vs Immigrants from North America Unemployment Among Women with Children Ages 6 to 17 years
COMPARE
Jordanian
Immigrants from North America
Unemployment Among Women with Children Ages 6 to 17 years
Unemployment Among Women with Children Ages 6 to 17 years Comparison
Jordanians
Immigrants from North America
9.0%
UNEMPLOYMENT AMONG WOMEN WITH CHILDREN AGES 6 TO 17 YEARS
52.2/ 100
METRIC RATING
171st/ 347
METRIC RANK
9.2%
UNEMPLOYMENT AMONG WOMEN WITH CHILDREN AGES 6 TO 17 YEARS
12.7/ 100
METRIC RATING
206th/ 347
METRIC RANK
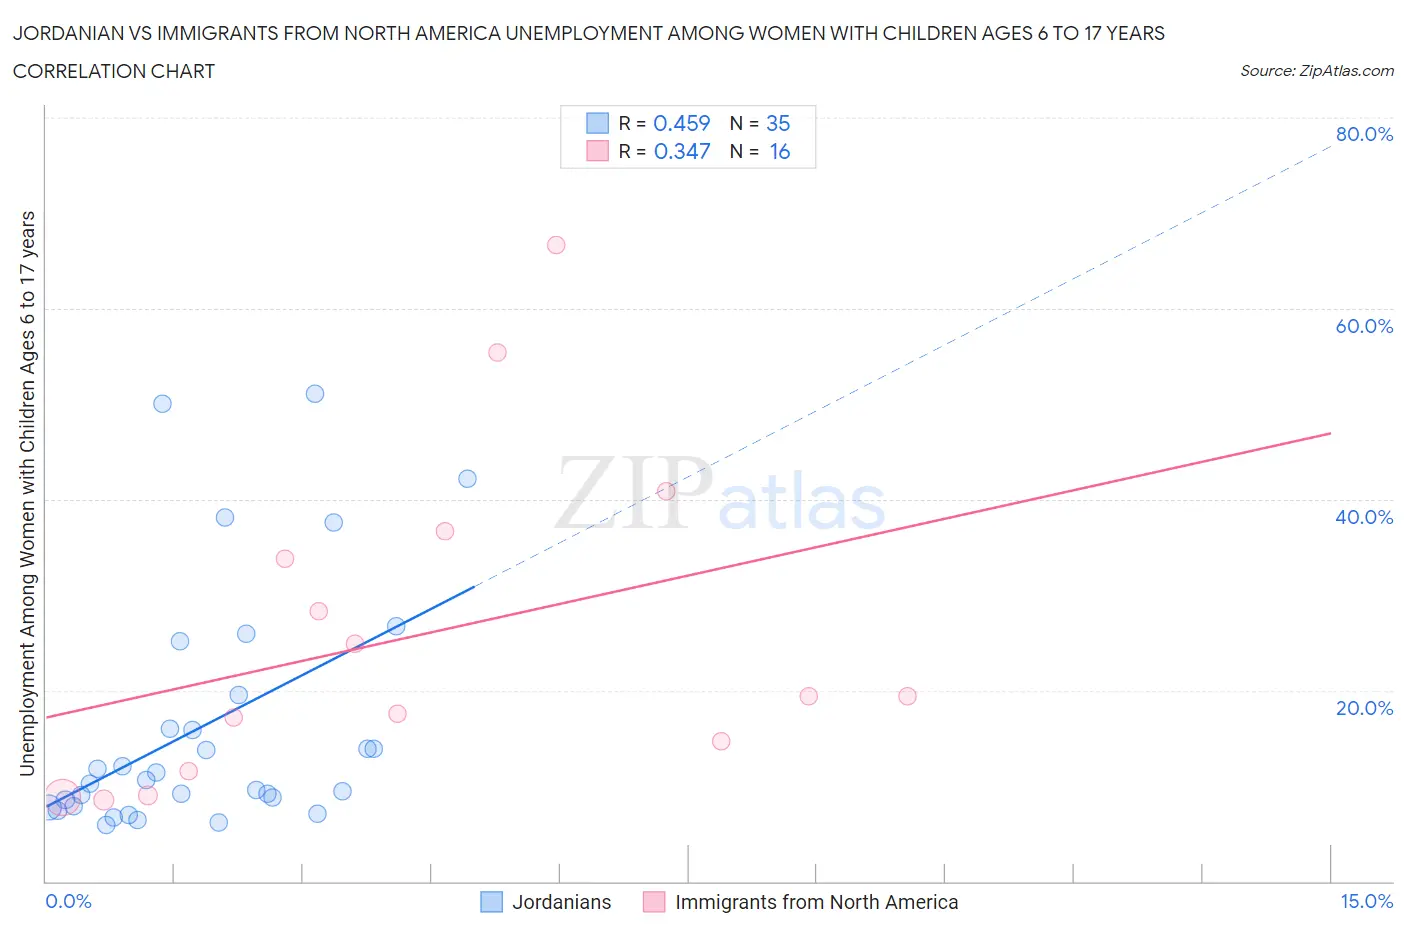
Jordanian vs Immigrants from North America Unemployment Among Women with Children Ages 6 to 17 years Correlation Chart
The statistical analysis conducted on geographies consisting of 139,824,688 people shows a moderate positive correlation between the proportion of Jordanians and unemployment rate among women with children between the ages 6 and 17 in the United States with a correlation coefficient (R) of 0.459 and weighted average of 9.0%. Similarly, the statistical analysis conducted on geographies consisting of 313,856,079 people shows a mild positive correlation between the proportion of Immigrants from North America and unemployment rate among women with children between the ages 6 and 17 in the United States with a correlation coefficient (R) of 0.347 and weighted average of 9.2%, a difference of 2.2%.
Unemployment Among Women with Children Ages 6 to 17 years Correlation Summary
| Measurement | Jordanian | Immigrants from North America |
| Minimum | 5.9% | 8.5% |
| Maximum | 51.1% | 66.7% |
| Range | 45.2% | 58.2% |
| Mean | 16.3% | 25.8% |
| Median | 10.6% | 19.4% |
| Interquartile 25% (IQ1) | 7.8% | 13.1% |
| Interquartile 75% (IQ3) | 19.5% | 35.2% |
| Interquartile Range (IQR) | 11.7% | 22.2% |
| Standard Deviation (Sample) | 12.8% | 17.1% |
| Standard Deviation (Population) | 12.6% | 16.6% |
Similar Demographics by Unemployment Among Women with Children Ages 6 to 17 years
Demographics Similar to Jordanians by Unemployment Among Women with Children Ages 6 to 17 years
In terms of unemployment among women with children ages 6 to 17 years, the demographic groups most similar to Jordanians are Immigrants from West Indies (9.0%, a difference of 0.0%), Immigrants from Brazil (9.0%, a difference of 0.050%), Turkish (8.9%, a difference of 0.090%), Immigrants from Costa Rica (9.0%, a difference of 0.10%), and British (8.9%, a difference of 0.14%).
| Demographics | Rating | Rank | Unemployment Among Women with Children Ages 6 to 17 years |
| Ukrainians | 59.7 /100 | #164 | Average 8.9% |
| Immigrants | Micronesia | 59.2 /100 | #165 | Average 8.9% |
| Moroccans | 58.3 /100 | #166 | Average 8.9% |
| Immigrants | England | 57.7 /100 | #167 | Average 8.9% |
| Immigrants | Croatia | 57.1 /100 | #168 | Average 8.9% |
| British | 55.2 /100 | #169 | Average 8.9% |
| Turks | 54.1 /100 | #170 | Average 8.9% |
| Jordanians | 52.2 /100 | #171 | Average 9.0% |
| Immigrants | West Indies | 52.2 /100 | #172 | Average 9.0% |
| Immigrants | Brazil | 51.0 /100 | #173 | Average 9.0% |
| Immigrants | Costa Rica | 50.0 /100 | #174 | Average 9.0% |
| Immigrants | Sierra Leone | 45.9 /100 | #175 | Average 9.0% |
| Immigrants | Italy | 43.7 /100 | #176 | Average 9.0% |
| Immigrants | Jordan | 41.6 /100 | #177 | Average 9.0% |
| Menominee | 39.3 /100 | #178 | Fair 9.0% |
Demographics Similar to Immigrants from North America by Unemployment Among Women with Children Ages 6 to 17 years
In terms of unemployment among women with children ages 6 to 17 years, the demographic groups most similar to Immigrants from North America are Immigrants from Western Europe (9.1%, a difference of 0.13%), Cuban (9.2%, a difference of 0.20%), Immigrants from Peru (9.2%, a difference of 0.20%), Salvadoran (9.2%, a difference of 0.21%), and Immigrants from Canada (9.1%, a difference of 0.23%).
| Demographics | Rating | Rank | Unemployment Among Women with Children Ages 6 to 17 years |
| Czechoslovakians | 20.8 /100 | #199 | Fair 9.1% |
| Trinidadians and Tobagonians | 18.2 /100 | #200 | Poor 9.1% |
| Immigrants | Trinidad and Tobago | 16.7 /100 | #201 | Poor 9.1% |
| Immigrants | Middle Africa | 15.6 /100 | #202 | Poor 9.1% |
| Maltese | 15.3 /100 | #203 | Poor 9.1% |
| Immigrants | Canada | 15.3 /100 | #204 | Poor 9.1% |
| Immigrants | Western Europe | 14.1 /100 | #205 | Poor 9.1% |
| Immigrants | North America | 12.7 /100 | #206 | Poor 9.2% |
| Cubans | 10.9 /100 | #207 | Poor 9.2% |
| Immigrants | Peru | 10.8 /100 | #208 | Poor 9.2% |
| Salvadorans | 10.7 /100 | #209 | Poor 9.2% |
| Finns | 10.0 /100 | #210 | Tragic 9.2% |
| Immigrants | Cuba | 9.6 /100 | #211 | Tragic 9.2% |
| Peruvians | 9.0 /100 | #212 | Tragic 9.2% |
| Spaniards | 8.2 /100 | #213 | Tragic 9.2% |