Italian vs Immigrants from Honduras Unemployment Among Ages 16 to 19 years
COMPARE
Italian
Immigrants from Honduras
Unemployment Among Ages 16 to 19 years
Unemployment Among Ages 16 to 19 years Comparison
Italians
Immigrants from Honduras
17.0%
UNEMPLOYMENT AMONG AGES 16 TO 19 YEARS
94.5/ 100
METRIC RATING
104th/ 347
METRIC RANK
19.0%
UNEMPLOYMENT AMONG AGES 16 TO 19 YEARS
0.1/ 100
METRIC RATING
266th/ 347
METRIC RANK
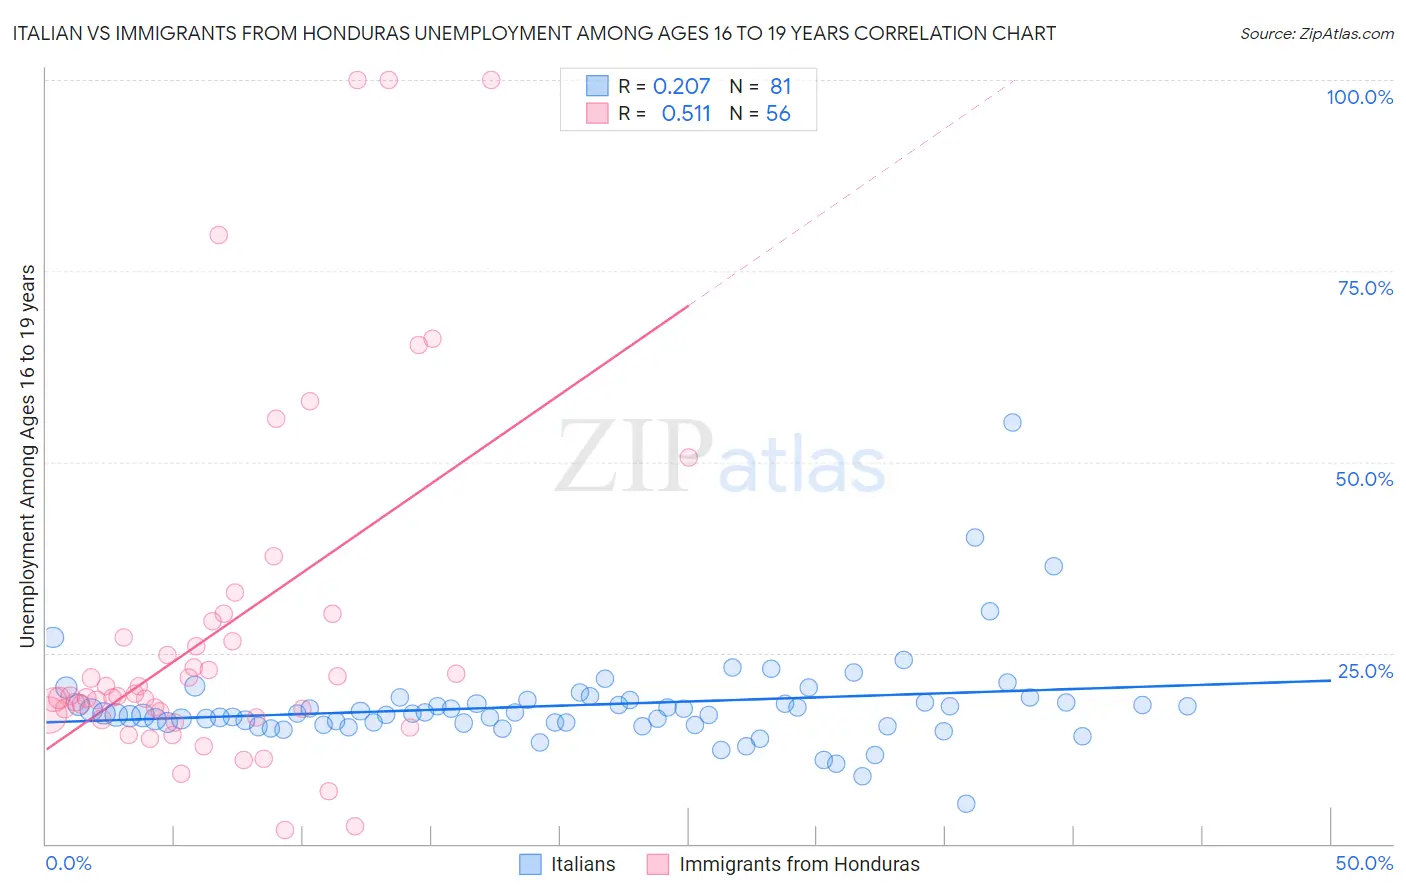
Italian vs Immigrants from Honduras Unemployment Among Ages 16 to 19 years Correlation Chart
The statistical analysis conducted on geographies consisting of 511,046,251 people shows a weak positive correlation between the proportion of Italians and unemployment rate among population between the ages 16 and 19 in the United States with a correlation coefficient (R) of 0.207 and weighted average of 17.0%. Similarly, the statistical analysis conducted on geographies consisting of 310,823,514 people shows a substantial positive correlation between the proportion of Immigrants from Honduras and unemployment rate among population between the ages 16 and 19 in the United States with a correlation coefficient (R) of 0.511 and weighted average of 19.0%, a difference of 11.8%.
Unemployment Among Ages 16 to 19 years Correlation Summary
| Measurement | Italian | Immigrants from Honduras |
| Minimum | 5.3% | 1.8% |
| Maximum | 55.1% | 100.0% |
| Range | 49.8% | 98.2% |
| Mean | 18.1% | 28.1% |
| Median | 17.1% | 19.4% |
| Interquartile 25% (IQ1) | 15.7% | 16.7% |
| Interquartile 75% (IQ3) | 18.7% | 28.0% |
| Interquartile Range (IQR) | 3.0% | 11.4% |
| Standard Deviation (Sample) | 6.4% | 23.1% |
| Standard Deviation (Population) | 6.3% | 22.9% |
Similar Demographics by Unemployment Among Ages 16 to 19 years
Demographics Similar to Italians by Unemployment Among Ages 16 to 19 years
In terms of unemployment among ages 16 to 19 years, the demographic groups most similar to Italians are Palestinian (17.0%, a difference of 0.0%), Immigrants from Pakistan (17.0%, a difference of 0.020%), Immigrants from Thailand (17.0%, a difference of 0.040%), Immigrants from Saudi Arabia (17.0%, a difference of 0.040%), and Immigrants from Bulgaria (17.0%, a difference of 0.050%).
| Demographics | Rating | Rank | Unemployment Among Ages 16 to 19 years |
| Immigrants | Venezuela | 95.3 /100 | #97 | Exceptional 16.9% |
| Burmese | 95.0 /100 | #98 | Exceptional 17.0% |
| Immigrants | Lithuania | 94.9 /100 | #99 | Exceptional 17.0% |
| Immigrants | Thailand | 94.7 /100 | #100 | Exceptional 17.0% |
| Immigrants | Saudi Arabia | 94.7 /100 | #101 | Exceptional 17.0% |
| Immigrants | Pakistan | 94.6 /100 | #102 | Exceptional 17.0% |
| Palestinians | 94.6 /100 | #103 | Exceptional 17.0% |
| Italians | 94.5 /100 | #104 | Exceptional 17.0% |
| Immigrants | Bulgaria | 94.3 /100 | #105 | Exceptional 17.0% |
| Estonians | 94.3 /100 | #106 | Exceptional 17.0% |
| Immigrants | Brazil | 94.2 /100 | #107 | Exceptional 17.0% |
| Malaysians | 94.2 /100 | #108 | Exceptional 17.0% |
| Iranians | 94.1 /100 | #109 | Exceptional 17.0% |
| Immigrants | Netherlands | 93.9 /100 | #110 | Exceptional 17.0% |
| Immigrants | Asia | 93.9 /100 | #111 | Exceptional 17.0% |
Demographics Similar to Immigrants from Honduras by Unemployment Among Ages 16 to 19 years
In terms of unemployment among ages 16 to 19 years, the demographic groups most similar to Immigrants from Honduras are Choctaw (19.0%, a difference of 0.090%), Yaqui (19.0%, a difference of 0.10%), Cree (19.0%, a difference of 0.13%), Salvadoran (18.9%, a difference of 0.26%), and Spanish American Indian (18.9%, a difference of 0.30%).
| Demographics | Rating | Rank | Unemployment Among Ages 16 to 19 years |
| Immigrants | Central America | 0.2 /100 | #259 | Tragic 18.9% |
| Nigerians | 0.2 /100 | #260 | Tragic 18.9% |
| Spanish American Indians | 0.1 /100 | #261 | Tragic 18.9% |
| Salvadorans | 0.1 /100 | #262 | Tragic 18.9% |
| Cree | 0.1 /100 | #263 | Tragic 19.0% |
| Yaqui | 0.1 /100 | #264 | Tragic 19.0% |
| Choctaw | 0.1 /100 | #265 | Tragic 19.0% |
| Immigrants | Honduras | 0.1 /100 | #266 | Tragic 19.0% |
| Israelis | 0.1 /100 | #267 | Tragic 19.0% |
| Immigrants | El Salvador | 0.1 /100 | #268 | Tragic 19.1% |
| Lumbee | 0.1 /100 | #269 | Tragic 19.1% |
| Hondurans | 0.1 /100 | #270 | Tragic 19.2% |
| Blackfeet | 0.0 /100 | #271 | Tragic 19.2% |
| Hispanics or Latinos | 0.0 /100 | #272 | Tragic 19.2% |
| Immigrants | Panama | 0.0 /100 | #273 | Tragic 19.3% |