Italian vs Alaska Native Unemployment Among Ages 16 to 19 years
COMPARE
Italian
Alaska Native
Unemployment Among Ages 16 to 19 years
Unemployment Among Ages 16 to 19 years Comparison
Italians
Alaska Natives
17.0%
UNEMPLOYMENT AMONG AGES 16 TO 19 YEARS
94.5/ 100
METRIC RATING
104th/ 347
METRIC RANK
21.8%
UNEMPLOYMENT AMONG AGES 16 TO 19 YEARS
0.0/ 100
METRIC RATING
314th/ 347
METRIC RANK
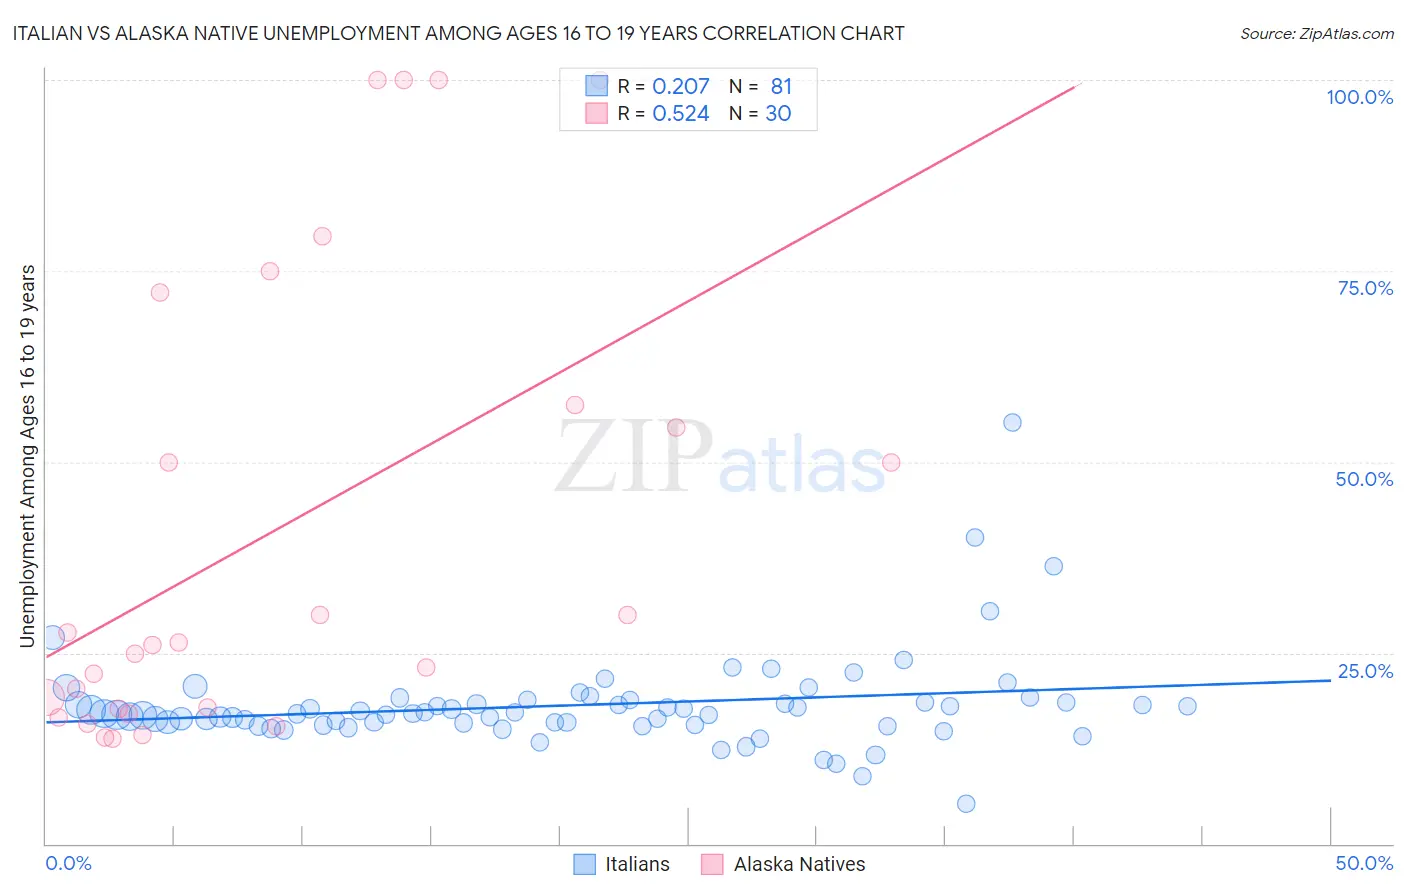
Italian vs Alaska Native Unemployment Among Ages 16 to 19 years Correlation Chart
The statistical analysis conducted on geographies consisting of 511,046,251 people shows a weak positive correlation between the proportion of Italians and unemployment rate among population between the ages 16 and 19 in the United States with a correlation coefficient (R) of 0.207 and weighted average of 17.0%. Similarly, the statistical analysis conducted on geographies consisting of 76,044,385 people shows a substantial positive correlation between the proportion of Alaska Natives and unemployment rate among population between the ages 16 and 19 in the United States with a correlation coefficient (R) of 0.524 and weighted average of 21.8%, a difference of 28.1%.
Unemployment Among Ages 16 to 19 years Correlation Summary
| Measurement | Italian | Alaska Native |
| Minimum | 5.3% | 13.8% |
| Maximum | 55.1% | 100.0% |
| Range | 49.8% | 86.2% |
| Mean | 18.1% | 41.0% |
| Median | 17.1% | 26.2% |
| Interquartile 25% (IQ1) | 15.7% | 17.7% |
| Interquartile 75% (IQ3) | 18.7% | 57.5% |
| Interquartile Range (IQR) | 3.0% | 39.7% |
| Standard Deviation (Sample) | 6.4% | 30.3% |
| Standard Deviation (Population) | 6.3% | 29.8% |
Similar Demographics by Unemployment Among Ages 16 to 19 years
Demographics Similar to Italians by Unemployment Among Ages 16 to 19 years
In terms of unemployment among ages 16 to 19 years, the demographic groups most similar to Italians are Palestinian (17.0%, a difference of 0.0%), Immigrants from Pakistan (17.0%, a difference of 0.020%), Immigrants from Thailand (17.0%, a difference of 0.040%), Immigrants from Saudi Arabia (17.0%, a difference of 0.040%), and Immigrants from Bulgaria (17.0%, a difference of 0.050%).
| Demographics | Rating | Rank | Unemployment Among Ages 16 to 19 years |
| Immigrants | Venezuela | 95.3 /100 | #97 | Exceptional 16.9% |
| Burmese | 95.0 /100 | #98 | Exceptional 17.0% |
| Immigrants | Lithuania | 94.9 /100 | #99 | Exceptional 17.0% |
| Immigrants | Thailand | 94.7 /100 | #100 | Exceptional 17.0% |
| Immigrants | Saudi Arabia | 94.7 /100 | #101 | Exceptional 17.0% |
| Immigrants | Pakistan | 94.6 /100 | #102 | Exceptional 17.0% |
| Palestinians | 94.6 /100 | #103 | Exceptional 17.0% |
| Italians | 94.5 /100 | #104 | Exceptional 17.0% |
| Immigrants | Bulgaria | 94.3 /100 | #105 | Exceptional 17.0% |
| Estonians | 94.3 /100 | #106 | Exceptional 17.0% |
| Immigrants | Brazil | 94.2 /100 | #107 | Exceptional 17.0% |
| Malaysians | 94.2 /100 | #108 | Exceptional 17.0% |
| Iranians | 94.1 /100 | #109 | Exceptional 17.0% |
| Immigrants | Netherlands | 93.9 /100 | #110 | Exceptional 17.0% |
| Immigrants | Asia | 93.9 /100 | #111 | Exceptional 17.0% |
Demographics Similar to Alaska Natives by Unemployment Among Ages 16 to 19 years
In terms of unemployment among ages 16 to 19 years, the demographic groups most similar to Alaska Natives are Jamaican (21.7%, a difference of 0.16%), Houma (21.6%, a difference of 0.58%), Belizean (21.6%, a difference of 0.84%), Immigrants from Dominica (21.9%, a difference of 0.85%), and Vietnamese (21.5%, a difference of 1.1%).
| Demographics | Rating | Rank | Unemployment Among Ages 16 to 19 years |
| Blacks/African Americans | 0.0 /100 | #307 | Tragic 21.4% |
| Immigrants | Bangladesh | 0.0 /100 | #308 | Tragic 21.5% |
| Natives/Alaskans | 0.0 /100 | #309 | Tragic 21.5% |
| Vietnamese | 0.0 /100 | #310 | Tragic 21.5% |
| Belizeans | 0.0 /100 | #311 | Tragic 21.6% |
| Houma | 0.0 /100 | #312 | Tragic 21.6% |
| Jamaicans | 0.0 /100 | #313 | Tragic 21.7% |
| Alaska Natives | 0.0 /100 | #314 | Tragic 21.8% |
| Immigrants | Dominica | 0.0 /100 | #315 | Tragic 21.9% |
| Tohono O'odham | 0.0 /100 | #316 | Tragic 22.1% |
| Immigrants | Belize | 0.0 /100 | #317 | Tragic 22.2% |
| Immigrants | Jamaica | 0.0 /100 | #318 | Tragic 22.2% |
| Immigrants | West Indies | 0.0 /100 | #319 | Tragic 22.2% |
| Cheyenne | 0.0 /100 | #320 | Tragic 22.3% |
| West Indians | 0.0 /100 | #321 | Tragic 22.4% |