Italian vs Immigrants from Grenada Unemployment Among Ages 16 to 19 years
COMPARE
Italian
Immigrants from Grenada
Unemployment Among Ages 16 to 19 years
Unemployment Among Ages 16 to 19 years Comparison
Italians
Immigrants from Grenada
17.0%
UNEMPLOYMENT AMONG AGES 16 TO 19 YEARS
94.5/ 100
METRIC RATING
104th/ 347
METRIC RANK
25.7%
UNEMPLOYMENT AMONG AGES 16 TO 19 YEARS
0.0/ 100
METRIC RATING
339th/ 347
METRIC RANK
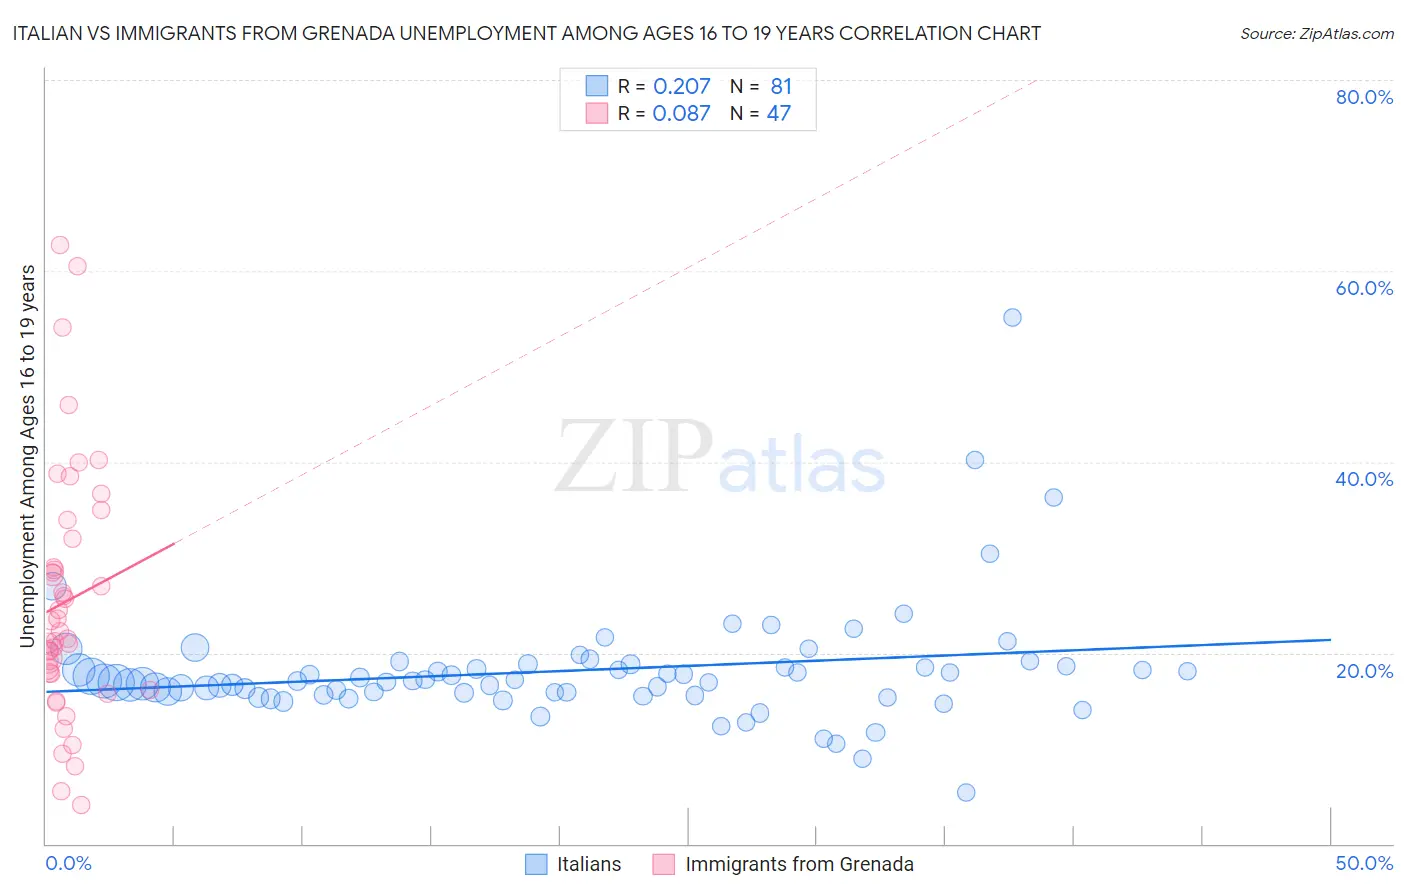
Italian vs Immigrants from Grenada Unemployment Among Ages 16 to 19 years Correlation Chart
The statistical analysis conducted on geographies consisting of 511,046,251 people shows a weak positive correlation between the proportion of Italians and unemployment rate among population between the ages 16 and 19 in the United States with a correlation coefficient (R) of 0.207 and weighted average of 17.0%. Similarly, the statistical analysis conducted on geographies consisting of 66,410,063 people shows a slight positive correlation between the proportion of Immigrants from Grenada and unemployment rate among population between the ages 16 and 19 in the United States with a correlation coefficient (R) of 0.087 and weighted average of 25.7%, a difference of 51.5%.
Unemployment Among Ages 16 to 19 years Correlation Summary
| Measurement | Italian | Immigrants from Grenada |
| Minimum | 5.3% | 4.1% |
| Maximum | 55.1% | 62.7% |
| Range | 49.8% | 58.6% |
| Mean | 18.1% | 25.4% |
| Median | 17.1% | 22.3% |
| Interquartile 25% (IQ1) | 15.7% | 17.8% |
| Interquartile 75% (IQ3) | 18.7% | 32.0% |
| Interquartile Range (IQR) | 3.0% | 14.2% |
| Standard Deviation (Sample) | 6.4% | 13.0% |
| Standard Deviation (Population) | 6.3% | 12.9% |
Similar Demographics by Unemployment Among Ages 16 to 19 years
Demographics Similar to Italians by Unemployment Among Ages 16 to 19 years
In terms of unemployment among ages 16 to 19 years, the demographic groups most similar to Italians are Palestinian (17.0%, a difference of 0.0%), Immigrants from Pakistan (17.0%, a difference of 0.020%), Immigrants from Thailand (17.0%, a difference of 0.040%), Immigrants from Saudi Arabia (17.0%, a difference of 0.040%), and Immigrants from Bulgaria (17.0%, a difference of 0.050%).
| Demographics | Rating | Rank | Unemployment Among Ages 16 to 19 years |
| Immigrants | Venezuela | 95.3 /100 | #97 | Exceptional 16.9% |
| Burmese | 95.0 /100 | #98 | Exceptional 17.0% |
| Immigrants | Lithuania | 94.9 /100 | #99 | Exceptional 17.0% |
| Immigrants | Thailand | 94.7 /100 | #100 | Exceptional 17.0% |
| Immigrants | Saudi Arabia | 94.7 /100 | #101 | Exceptional 17.0% |
| Immigrants | Pakistan | 94.6 /100 | #102 | Exceptional 17.0% |
| Palestinians | 94.6 /100 | #103 | Exceptional 17.0% |
| Italians | 94.5 /100 | #104 | Exceptional 17.0% |
| Immigrants | Bulgaria | 94.3 /100 | #105 | Exceptional 17.0% |
| Estonians | 94.3 /100 | #106 | Exceptional 17.0% |
| Immigrants | Brazil | 94.2 /100 | #107 | Exceptional 17.0% |
| Malaysians | 94.2 /100 | #108 | Exceptional 17.0% |
| Iranians | 94.1 /100 | #109 | Exceptional 17.0% |
| Immigrants | Netherlands | 93.9 /100 | #110 | Exceptional 17.0% |
| Immigrants | Asia | 93.9 /100 | #111 | Exceptional 17.0% |
Demographics Similar to Immigrants from Grenada by Unemployment Among Ages 16 to 19 years
In terms of unemployment among ages 16 to 19 years, the demographic groups most similar to Immigrants from Grenada are Immigrants from St. Vincent and the Grenadines (25.7%, a difference of 0.19%), Immigrants from Guyana (25.5%, a difference of 1.0%), Crow (26.2%, a difference of 1.9%), Kiowa (25.2%, a difference of 2.1%), and Arapaho (25.2%, a difference of 2.3%).
| Demographics | Rating | Rank | Unemployment Among Ages 16 to 19 years |
| Immigrants | Barbados | 0.0 /100 | #332 | Tragic 24.0% |
| Paiute | 0.0 /100 | #333 | Tragic 24.4% |
| Guyanese | 0.0 /100 | #334 | Tragic 24.8% |
| Arapaho | 0.0 /100 | #335 | Tragic 25.2% |
| Kiowa | 0.0 /100 | #336 | Tragic 25.2% |
| Immigrants | Guyana | 0.0 /100 | #337 | Tragic 25.5% |
| Immigrants | St. Vincent and the Grenadines | 0.0 /100 | #338 | Tragic 25.7% |
| Immigrants | Grenada | 0.0 /100 | #339 | Tragic 25.7% |
| Crow | 0.0 /100 | #340 | Tragic 26.2% |
| Puerto Ricans | 0.0 /100 | #341 | Tragic 27.5% |
| Inupiat | 0.0 /100 | #342 | Tragic 28.1% |
| Navajo | 0.0 /100 | #343 | Tragic 29.0% |
| Colville | 0.0 /100 | #344 | Tragic 29.7% |
| Hopi | 0.0 /100 | #345 | Tragic 30.7% |
| Yuman | 0.0 /100 | #346 | Tragic 37.4% |