Indian (Asian) vs Immigrants from Bolivia Unemployment Among Ages 25 to 29 years
COMPARE
Indian (Asian)
Immigrants from Bolivia
Unemployment Among Ages 25 to 29 years
Unemployment Among Ages 25 to 29 years Comparison
Indians (Asian)
Immigrants from Bolivia
6.3%
UNEMPLOYMENT AMONG AGES 25 TO 29 YEARS
97.8/ 100
METRIC RATING
66th/ 347
METRIC RANK
5.9%
UNEMPLOYMENT AMONG AGES 25 TO 29 YEARS
100.0/ 100
METRIC RATING
13th/ 347
METRIC RANK
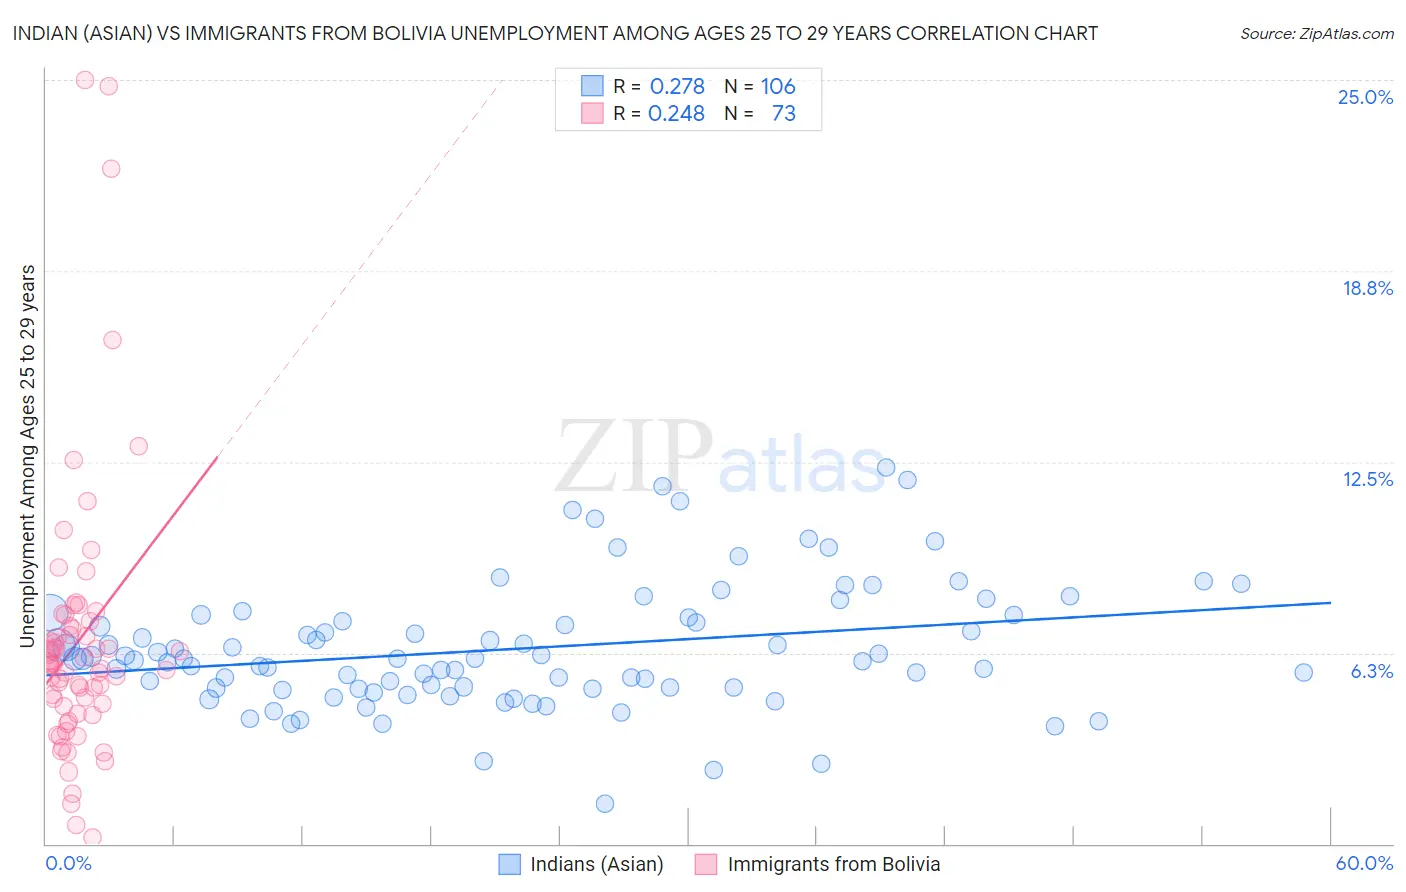
Indian (Asian) vs Immigrants from Bolivia Unemployment Among Ages 25 to 29 years Correlation Chart
The statistical analysis conducted on geographies consisting of 460,677,018 people shows a weak positive correlation between the proportion of Indians (Asian) and unemployment rate among population between the ages 25 and 29 in the United States with a correlation coefficient (R) of 0.278 and weighted average of 6.3%. Similarly, the statistical analysis conducted on geographies consisting of 155,444,296 people shows a weak positive correlation between the proportion of Immigrants from Bolivia and unemployment rate among population between the ages 25 and 29 in the United States with a correlation coefficient (R) of 0.248 and weighted average of 5.9%, a difference of 6.9%.
Unemployment Among Ages 25 to 29 years Correlation Summary
| Measurement | Indian (Asian) | Immigrants from Bolivia |
| Minimum | 1.3% | 0.20% |
| Maximum | 12.3% | 25.0% |
| Range | 11.0% | 24.8% |
| Mean | 6.4% | 6.6% |
| Median | 6.1% | 5.9% |
| Interquartile 25% (IQ1) | 5.1% | 4.4% |
| Interquartile 75% (IQ3) | 7.4% | 7.2% |
| Interquartile Range (IQR) | 2.3% | 2.8% |
| Standard Deviation (Sample) | 2.0% | 4.5% |
| Standard Deviation (Population) | 2.0% | 4.5% |
Similar Demographics by Unemployment Among Ages 25 to 29 years
Demographics Similar to Indians (Asian) by Unemployment Among Ages 25 to 29 years
In terms of unemployment among ages 25 to 29 years, the demographic groups most similar to Indians (Asian) are Immigrants from Northern Africa (6.3%, a difference of 0.010%), Immigrants from Lebanon (6.3%, a difference of 0.020%), Palestinian (6.3%, a difference of 0.050%), Immigrants from Sri Lanka (6.3%, a difference of 0.070%), and Kenyan (6.3%, a difference of 0.12%).
| Demographics | Rating | Rank | Unemployment Among Ages 25 to 29 years |
| Luxembourgers | 98.3 /100 | #59 | Exceptional 6.2% |
| Immigrants | Taiwan | 98.3 /100 | #60 | Exceptional 6.2% |
| Bhutanese | 98.2 /100 | #61 | Exceptional 6.2% |
| Immigrants | China | 98.1 /100 | #62 | Exceptional 6.2% |
| Kenyans | 98.0 /100 | #63 | Exceptional 6.3% |
| Immigrants | Sri Lanka | 97.9 /100 | #64 | Exceptional 6.3% |
| Immigrants | Lebanon | 97.8 /100 | #65 | Exceptional 6.3% |
| Indians (Asian) | 97.8 /100 | #66 | Exceptional 6.3% |
| Immigrants | Northern Africa | 97.8 /100 | #67 | Exceptional 6.3% |
| Palestinians | 97.7 /100 | #68 | Exceptional 6.3% |
| Immigrants | Hong Kong | 97.5 /100 | #69 | Exceptional 6.3% |
| Immigrants | Malaysia | 97.5 /100 | #70 | Exceptional 6.3% |
| Immigrants | France | 97.4 /100 | #71 | Exceptional 6.3% |
| Scandinavians | 97.4 /100 | #72 | Exceptional 6.3% |
| Belgians | 97.0 /100 | #73 | Exceptional 6.3% |
Demographics Similar to Immigrants from Bolivia by Unemployment Among Ages 25 to 29 years
In terms of unemployment among ages 25 to 29 years, the demographic groups most similar to Immigrants from Bolivia are Okinawan (5.9%, a difference of 0.030%), Cambodian (5.8%, a difference of 0.15%), Immigrants from Kuwait (5.9%, a difference of 0.63%), Cuban (5.9%, a difference of 0.97%), and Immigrants from Bulgaria (5.9%, a difference of 0.99%).
| Demographics | Rating | Rank | Unemployment Among Ages 25 to 29 years |
| Hmong | 100.0 /100 | #6 | Exceptional 5.7% |
| Immigrants | India | 100.0 /100 | #7 | Exceptional 5.7% |
| Immigrants | Bosnia and Herzegovina | 100.0 /100 | #8 | Exceptional 5.7% |
| Immigrants | Nepal | 100.0 /100 | #9 | Exceptional 5.7% |
| Immigrants | Sudan | 100.0 /100 | #10 | Exceptional 5.8% |
| Cambodians | 100.0 /100 | #11 | Exceptional 5.8% |
| Okinawans | 100.0 /100 | #12 | Exceptional 5.9% |
| Immigrants | Bolivia | 100.0 /100 | #13 | Exceptional 5.9% |
| Immigrants | Kuwait | 99.9 /100 | #14 | Exceptional 5.9% |
| Cubans | 99.9 /100 | #15 | Exceptional 5.9% |
| Immigrants | Bulgaria | 99.9 /100 | #16 | Exceptional 5.9% |
| Bolivians | 99.9 /100 | #17 | Exceptional 5.9% |
| Immigrants | Singapore | 99.9 /100 | #18 | Exceptional 5.9% |
| Thais | 99.9 /100 | #19 | Exceptional 5.9% |
| Immigrants | Eritrea | 99.9 /100 | #20 | Exceptional 5.9% |