Argentinean vs Immigrants from Bolivia Unemployment Among Ages 25 to 29 years
COMPARE
Argentinean
Immigrants from Bolivia
Unemployment Among Ages 25 to 29 years
Unemployment Among Ages 25 to 29 years Comparison
Argentineans
Immigrants from Bolivia
6.7%
UNEMPLOYMENT AMONG AGES 25 TO 29 YEARS
32.1/ 100
METRIC RATING
189th/ 347
METRIC RANK
5.9%
UNEMPLOYMENT AMONG AGES 25 TO 29 YEARS
100.0/ 100
METRIC RATING
13th/ 347
METRIC RANK
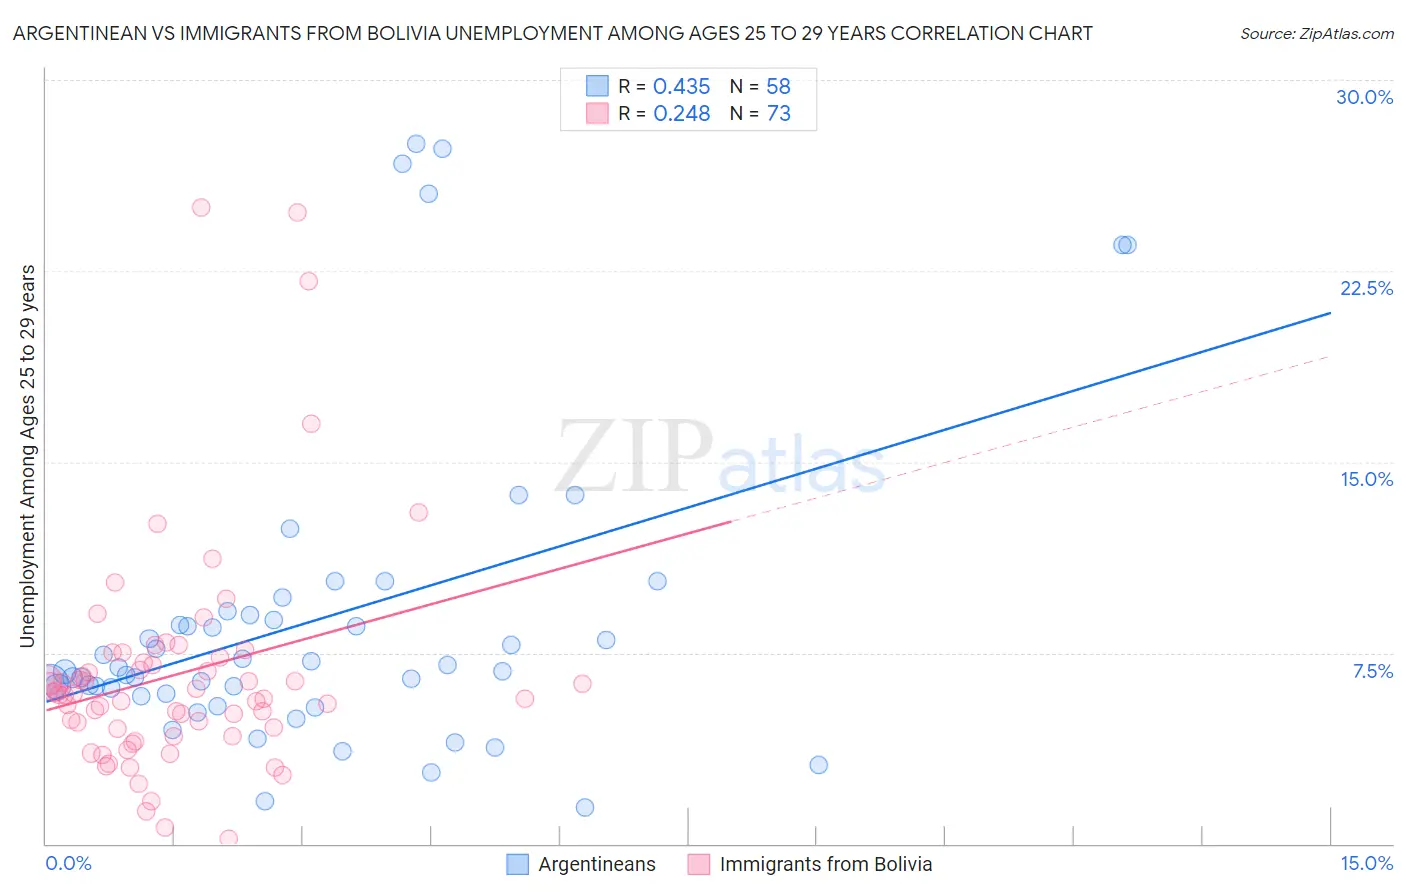
Argentinean vs Immigrants from Bolivia Unemployment Among Ages 25 to 29 years Correlation Chart
The statistical analysis conducted on geographies consisting of 287,291,410 people shows a moderate positive correlation between the proportion of Argentineans and unemployment rate among population between the ages 25 and 29 in the United States with a correlation coefficient (R) of 0.435 and weighted average of 6.7%. Similarly, the statistical analysis conducted on geographies consisting of 155,444,296 people shows a weak positive correlation between the proportion of Immigrants from Bolivia and unemployment rate among population between the ages 25 and 29 in the United States with a correlation coefficient (R) of 0.248 and weighted average of 5.9%, a difference of 14.9%.
Unemployment Among Ages 25 to 29 years Correlation Summary
| Measurement | Argentinean | Immigrants from Bolivia |
| Minimum | 1.4% | 0.20% |
| Maximum | 27.5% | 25.0% |
| Range | 26.1% | 24.8% |
| Mean | 8.9% | 6.6% |
| Median | 6.9% | 5.9% |
| Interquartile 25% (IQ1) | 5.9% | 4.4% |
| Interquartile 75% (IQ3) | 9.0% | 7.2% |
| Interquartile Range (IQR) | 3.1% | 2.8% |
| Standard Deviation (Sample) | 6.3% | 4.5% |
| Standard Deviation (Population) | 6.2% | 4.5% |
Similar Demographics by Unemployment Among Ages 25 to 29 years
Demographics Similar to Argentineans by Unemployment Among Ages 25 to 29 years
In terms of unemployment among ages 25 to 29 years, the demographic groups most similar to Argentineans are Irish (6.7%, a difference of 0.050%), Immigrants from South America (6.7%, a difference of 0.060%), Immigrants from Iran (6.7%, a difference of 0.16%), Korean (6.7%, a difference of 0.20%), and Moroccan (6.7%, a difference of 0.25%).
| Demographics | Rating | Rank | Unemployment Among Ages 25 to 29 years |
| Czechoslovakians | 40.7 /100 | #182 | Average 6.7% |
| Immigrants | Scotland | 39.6 /100 | #183 | Fair 6.7% |
| Immigrants | Costa Rica | 38.3 /100 | #184 | Fair 6.7% |
| Moroccans | 35.9 /100 | #185 | Fair 6.7% |
| Immigrants | Iran | 34.4 /100 | #186 | Fair 6.7% |
| Immigrants | South America | 33.0 /100 | #187 | Fair 6.7% |
| Irish | 32.8 /100 | #188 | Fair 6.7% |
| Argentineans | 32.1 /100 | #189 | Fair 6.7% |
| Koreans | 29.3 /100 | #190 | Fair 6.7% |
| Chickasaw | 28.7 /100 | #191 | Fair 6.7% |
| Immigrants | Ukraine | 28.6 /100 | #192 | Fair 6.7% |
| Alsatians | 28.1 /100 | #193 | Fair 6.7% |
| Immigrants | Greece | 28.0 /100 | #194 | Fair 6.7% |
| Immigrants | Western Asia | 27.3 /100 | #195 | Fair 6.7% |
| Hungarians | 26.8 /100 | #196 | Fair 6.8% |
Demographics Similar to Immigrants from Bolivia by Unemployment Among Ages 25 to 29 years
In terms of unemployment among ages 25 to 29 years, the demographic groups most similar to Immigrants from Bolivia are Okinawan (5.9%, a difference of 0.030%), Cambodian (5.8%, a difference of 0.15%), Immigrants from Kuwait (5.9%, a difference of 0.63%), Cuban (5.9%, a difference of 0.97%), and Immigrants from Bulgaria (5.9%, a difference of 0.99%).
| Demographics | Rating | Rank | Unemployment Among Ages 25 to 29 years |
| Hmong | 100.0 /100 | #6 | Exceptional 5.7% |
| Immigrants | India | 100.0 /100 | #7 | Exceptional 5.7% |
| Immigrants | Bosnia and Herzegovina | 100.0 /100 | #8 | Exceptional 5.7% |
| Immigrants | Nepal | 100.0 /100 | #9 | Exceptional 5.7% |
| Immigrants | Sudan | 100.0 /100 | #10 | Exceptional 5.8% |
| Cambodians | 100.0 /100 | #11 | Exceptional 5.8% |
| Okinawans | 100.0 /100 | #12 | Exceptional 5.9% |
| Immigrants | Bolivia | 100.0 /100 | #13 | Exceptional 5.9% |
| Immigrants | Kuwait | 99.9 /100 | #14 | Exceptional 5.9% |
| Cubans | 99.9 /100 | #15 | Exceptional 5.9% |
| Immigrants | Bulgaria | 99.9 /100 | #16 | Exceptional 5.9% |
| Bolivians | 99.9 /100 | #17 | Exceptional 5.9% |
| Immigrants | Singapore | 99.9 /100 | #18 | Exceptional 5.9% |
| Thais | 99.9 /100 | #19 | Exceptional 5.9% |
| Immigrants | Eritrea | 99.9 /100 | #20 | Exceptional 5.9% |