Immigrants from Haiti vs Immigrants from Bolivia Unemployment Among Ages 25 to 29 years
COMPARE
Immigrants from Haiti
Immigrants from Bolivia
Unemployment Among Ages 25 to 29 years
Unemployment Among Ages 25 to 29 years Comparison
Immigrants from Haiti
Immigrants from Bolivia
8.1%
UNEMPLOYMENT AMONG AGES 25 TO 29 YEARS
0.0/ 100
METRIC RATING
309th/ 347
METRIC RANK
5.9%
UNEMPLOYMENT AMONG AGES 25 TO 29 YEARS
100.0/ 100
METRIC RATING
13th/ 347
METRIC RANK
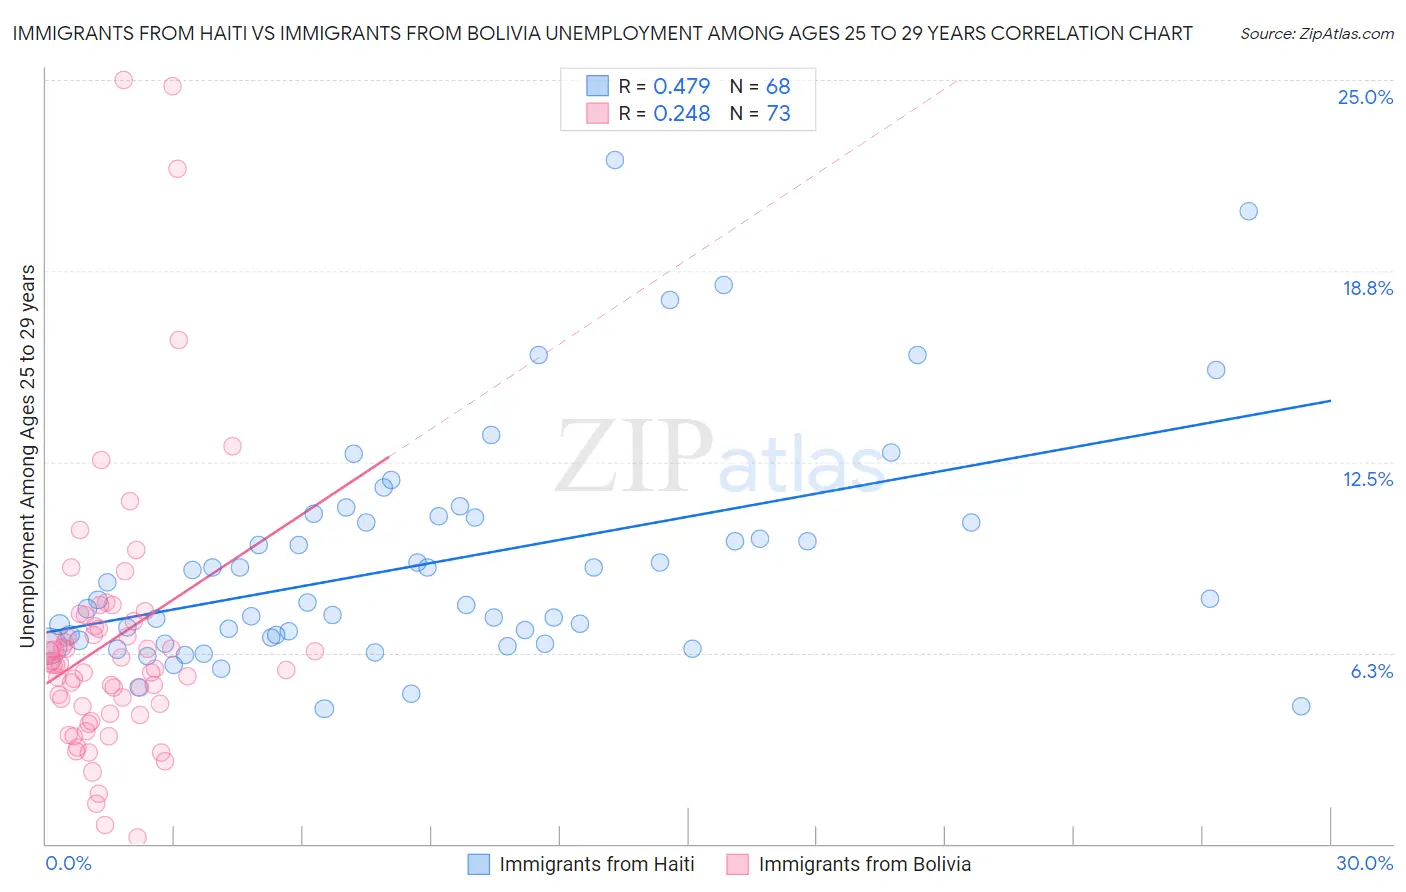
Immigrants from Haiti vs Immigrants from Bolivia Unemployment Among Ages 25 to 29 years Correlation Chart
The statistical analysis conducted on geographies consisting of 218,635,860 people shows a moderate positive correlation between the proportion of Immigrants from Haiti and unemployment rate among population between the ages 25 and 29 in the United States with a correlation coefficient (R) of 0.479 and weighted average of 8.1%. Similarly, the statistical analysis conducted on geographies consisting of 155,444,296 people shows a weak positive correlation between the proportion of Immigrants from Bolivia and unemployment rate among population between the ages 25 and 29 in the United States with a correlation coefficient (R) of 0.248 and weighted average of 5.9%, a difference of 38.1%.
Unemployment Among Ages 25 to 29 years Correlation Summary
| Measurement | Immigrants from Haiti | Immigrants from Bolivia |
| Minimum | 4.4% | 0.20% |
| Maximum | 22.4% | 25.0% |
| Range | 18.0% | 24.8% |
| Mean | 9.2% | 6.6% |
| Median | 7.9% | 5.9% |
| Interquartile 25% (IQ1) | 6.7% | 4.4% |
| Interquartile 75% (IQ3) | 10.6% | 7.2% |
| Interquartile Range (IQR) | 3.9% | 2.8% |
| Standard Deviation (Sample) | 3.7% | 4.5% |
| Standard Deviation (Population) | 3.7% | 4.5% |
Similar Demographics by Unemployment Among Ages 25 to 29 years
Demographics Similar to Immigrants from Haiti by Unemployment Among Ages 25 to 29 years
In terms of unemployment among ages 25 to 29 years, the demographic groups most similar to Immigrants from Haiti are Immigrants from Jamaica (8.1%, a difference of 0.010%), U.S. Virgin Islander (8.1%, a difference of 0.010%), Immigrants from the Azores (8.1%, a difference of 0.25%), Immigrants from Barbados (8.0%, a difference of 0.43%), and Haitian (8.0%, a difference of 0.59%).
| Demographics | Rating | Rank | Unemployment Among Ages 25 to 29 years |
| Jamaicans | 0.0 /100 | #302 | Tragic 7.9% |
| Immigrants | Yemen | 0.0 /100 | #303 | Tragic 8.0% |
| Cajuns | 0.0 /100 | #304 | Tragic 8.0% |
| Tsimshian | 0.0 /100 | #305 | Tragic 8.0% |
| Haitians | 0.0 /100 | #306 | Tragic 8.0% |
| Immigrants | Barbados | 0.0 /100 | #307 | Tragic 8.0% |
| Immigrants | Jamaica | 0.0 /100 | #308 | Tragic 8.1% |
| Immigrants | Haiti | 0.0 /100 | #309 | Tragic 8.1% |
| U.S. Virgin Islanders | 0.0 /100 | #310 | Tragic 8.1% |
| Immigrants | Azores | 0.0 /100 | #311 | Tragic 8.1% |
| Dutch West Indians | 0.0 /100 | #312 | Tragic 8.2% |
| Immigrants | St. Vincent and the Grenadines | 0.0 /100 | #313 | Tragic 8.4% |
| Immigrants | Dominica | 0.0 /100 | #314 | Tragic 8.4% |
| British West Indians | 0.0 /100 | #315 | Tragic 8.4% |
| Immigrants | Grenada | 0.0 /100 | #316 | Tragic 8.4% |
Demographics Similar to Immigrants from Bolivia by Unemployment Among Ages 25 to 29 years
In terms of unemployment among ages 25 to 29 years, the demographic groups most similar to Immigrants from Bolivia are Okinawan (5.9%, a difference of 0.030%), Cambodian (5.8%, a difference of 0.15%), Immigrants from Kuwait (5.9%, a difference of 0.63%), Cuban (5.9%, a difference of 0.97%), and Immigrants from Bulgaria (5.9%, a difference of 0.99%).
| Demographics | Rating | Rank | Unemployment Among Ages 25 to 29 years |
| Hmong | 100.0 /100 | #6 | Exceptional 5.7% |
| Immigrants | India | 100.0 /100 | #7 | Exceptional 5.7% |
| Immigrants | Bosnia and Herzegovina | 100.0 /100 | #8 | Exceptional 5.7% |
| Immigrants | Nepal | 100.0 /100 | #9 | Exceptional 5.7% |
| Immigrants | Sudan | 100.0 /100 | #10 | Exceptional 5.8% |
| Cambodians | 100.0 /100 | #11 | Exceptional 5.8% |
| Okinawans | 100.0 /100 | #12 | Exceptional 5.9% |
| Immigrants | Bolivia | 100.0 /100 | #13 | Exceptional 5.9% |
| Immigrants | Kuwait | 99.9 /100 | #14 | Exceptional 5.9% |
| Cubans | 99.9 /100 | #15 | Exceptional 5.9% |
| Immigrants | Bulgaria | 99.9 /100 | #16 | Exceptional 5.9% |
| Bolivians | 99.9 /100 | #17 | Exceptional 5.9% |
| Immigrants | Singapore | 99.9 /100 | #18 | Exceptional 5.9% |
| Thais | 99.9 /100 | #19 | Exceptional 5.9% |
| Immigrants | Eritrea | 99.9 /100 | #20 | Exceptional 5.9% |