Immigrants from Taiwan vs Estonian Unemployment Among Women with Children Ages 6 to 17 years
COMPARE
Immigrants from Taiwan
Estonian
Unemployment Among Women with Children Ages 6 to 17 years
Unemployment Among Women with Children Ages 6 to 17 years Comparison
Immigrants from Taiwan
Estonians
7.3%
UNEMPLOYMENT AMONG WOMEN WITH CHILDREN AGES 6 TO 17 YEARS
100.0/ 100
METRIC RATING
11th/ 347
METRIC RANK
9.3%
UNEMPLOYMENT AMONG WOMEN WITH CHILDREN AGES 6 TO 17 YEARS
4.4/ 100
METRIC RATING
228th/ 347
METRIC RANK
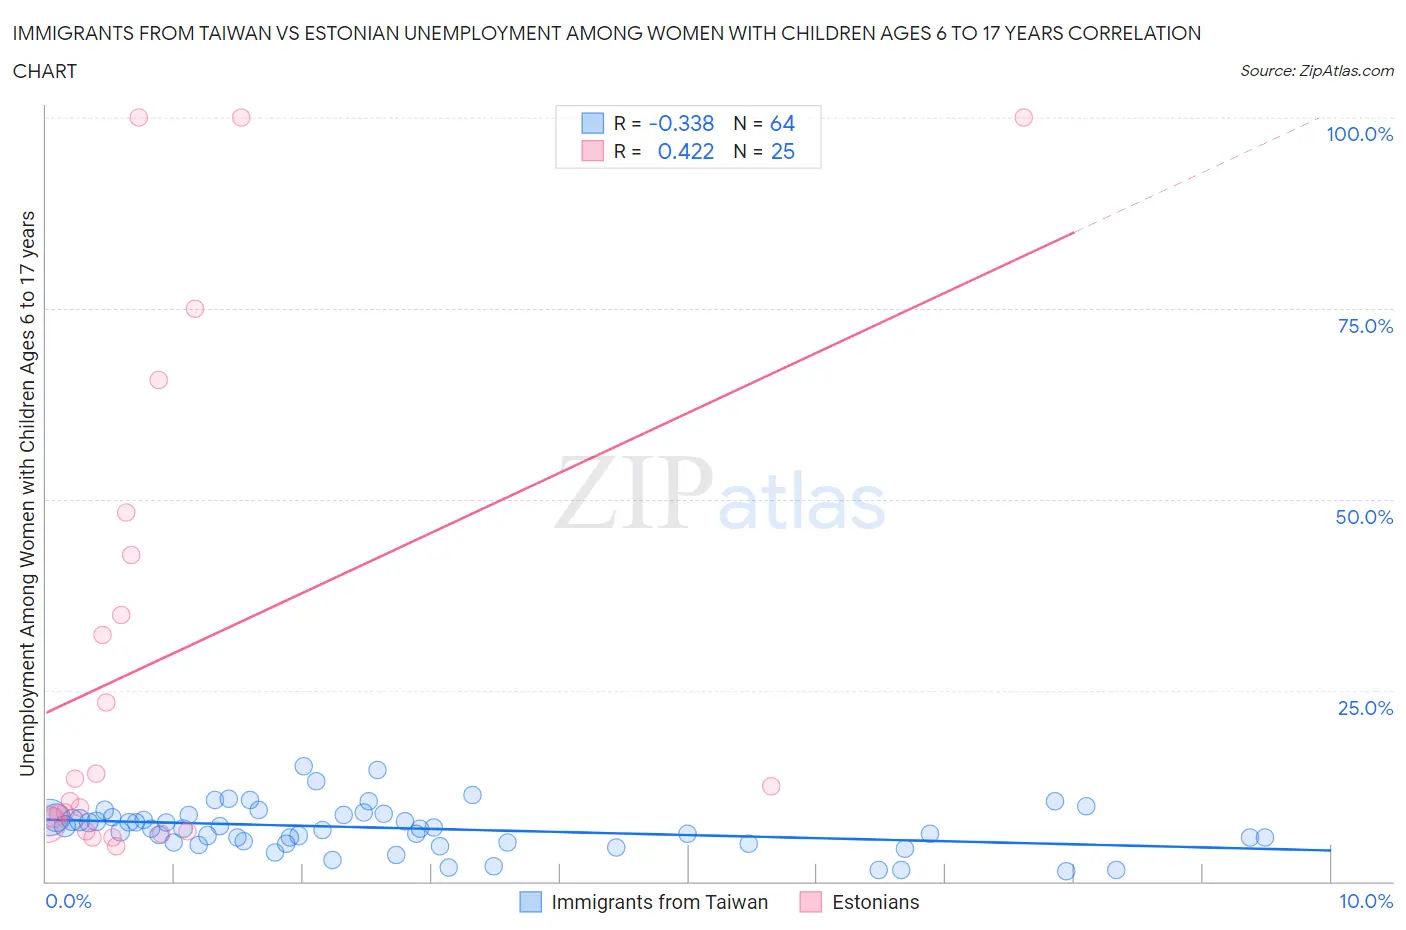
Immigrants from Taiwan vs Estonian Unemployment Among Women with Children Ages 6 to 17 years Correlation Chart
The statistical analysis conducted on geographies consisting of 225,183,414 people shows a mild negative correlation between the proportion of Immigrants from Taiwan and unemployment rate among women with children between the ages 6 and 17 in the United States with a correlation coefficient (R) of -0.338 and weighted average of 7.3%. Similarly, the statistical analysis conducted on geographies consisting of 102,254,464 people shows a moderate positive correlation between the proportion of Estonians and unemployment rate among women with children between the ages 6 and 17 in the United States with a correlation coefficient (R) of 0.422 and weighted average of 9.3%, a difference of 26.5%.
Unemployment Among Women with Children Ages 6 to 17 years Correlation Summary
| Measurement | Immigrants from Taiwan | Estonian |
| Minimum | 1.3% | 4.5% |
| Maximum | 15.0% | 100.0% |
| Range | 13.7% | 95.5% |
| Mean | 6.9% | 30.0% |
| Median | 6.9% | 12.5% |
| Interquartile 25% (IQ1) | 5.0% | 7.0% |
| Interquartile 75% (IQ3) | 8.6% | 45.5% |
| Interquartile Range (IQR) | 3.5% | 38.5% |
| Standard Deviation (Sample) | 3.0% | 32.6% |
| Standard Deviation (Population) | 3.0% | 32.0% |
Similar Demographics by Unemployment Among Women with Children Ages 6 to 17 years
Demographics Similar to Immigrants from Taiwan by Unemployment Among Women with Children Ages 6 to 17 years
In terms of unemployment among women with children ages 6 to 17 years, the demographic groups most similar to Immigrants from Taiwan are Bangladeshi (7.4%, a difference of 0.33%), Immigrants from Fiji (7.3%, a difference of 0.70%), Indonesian (7.4%, a difference of 1.0%), Sudanese (7.4%, a difference of 1.1%), and Assyrian/Chaldean/Syriac (7.2%, a difference of 1.7%).
| Demographics | Rating | Rank | Unemployment Among Women with Children Ages 6 to 17 years |
| Ute | 100.0 /100 | #4 | Exceptional 7.0% |
| Okinawans | 100.0 /100 | #5 | Exceptional 7.0% |
| Tlingit-Haida | 100.0 /100 | #6 | Exceptional 7.1% |
| Soviet Union | 100.0 /100 | #7 | Exceptional 7.1% |
| Immigrants | Hong Kong | 100.0 /100 | #8 | Exceptional 7.2% |
| Assyrians/Chaldeans/Syriacs | 100.0 /100 | #9 | Exceptional 7.2% |
| Immigrants | Fiji | 100.0 /100 | #10 | Exceptional 7.3% |
| Immigrants | Taiwan | 100.0 /100 | #11 | Exceptional 7.3% |
| Bangladeshis | 100.0 /100 | #12 | Exceptional 7.4% |
| Indonesians | 100.0 /100 | #13 | Exceptional 7.4% |
| Sudanese | 100.0 /100 | #14 | Exceptional 7.4% |
| Puget Sound Salish | 100.0 /100 | #15 | Exceptional 7.5% |
| Immigrants | Burma/Myanmar | 100.0 /100 | #16 | Exceptional 7.5% |
| Cambodians | 100.0 /100 | #17 | Exceptional 7.5% |
| Afghans | 100.0 /100 | #18 | Exceptional 7.6% |
Demographics Similar to Estonians by Unemployment Among Women with Children Ages 6 to 17 years
In terms of unemployment among women with children ages 6 to 17 years, the demographic groups most similar to Estonians are Panamanian (9.3%, a difference of 0.020%), Lumbee (9.3%, a difference of 0.030%), Immigrants from the Azores (9.3%, a difference of 0.050%), Welsh (9.3%, a difference of 0.13%), and Macedonian (9.3%, a difference of 0.14%).
| Demographics | Rating | Rank | Unemployment Among Women with Children Ages 6 to 17 years |
| Crow | 5.8 /100 | #221 | Tragic 9.2% |
| Immigrants | Southern Europe | 5.8 /100 | #222 | Tragic 9.2% |
| Immigrants | Eritrea | 5.8 /100 | #223 | Tragic 9.2% |
| Immigrants | El Salvador | 5.3 /100 | #224 | Tragic 9.3% |
| Chinese | 5.2 /100 | #225 | Tragic 9.3% |
| Immigrants | Azores | 4.6 /100 | #226 | Tragic 9.3% |
| Panamanians | 4.5 /100 | #227 | Tragic 9.3% |
| Estonians | 4.4 /100 | #228 | Tragic 9.3% |
| Lumbee | 4.3 /100 | #229 | Tragic 9.3% |
| Welsh | 4.0 /100 | #230 | Tragic 9.3% |
| Macedonians | 3.9 /100 | #231 | Tragic 9.3% |
| French American Indians | 3.7 /100 | #232 | Tragic 9.3% |
| Immigrants | St. Vincent and the Grenadines | 3.3 /100 | #233 | Tragic 9.3% |
| Mexicans | 3.2 /100 | #234 | Tragic 9.3% |
| Uruguayans | 3.0 /100 | #235 | Tragic 9.3% |