Immigrants from Southern Europe vs Immigrants from Colombia Unemployment Among Women with Children Ages 6 to 17 years
COMPARE
Immigrants from Southern Europe
Immigrants from Colombia
Unemployment Among Women with Children Ages 6 to 17 years
Unemployment Among Women with Children Ages 6 to 17 years Comparison
Immigrants from Southern Europe
Immigrants from Colombia
9.2%
UNEMPLOYMENT AMONG WOMEN WITH CHILDREN AGES 6 TO 17 YEARS
5.8/ 100
METRIC RATING
222nd/ 347
METRIC RANK
9.3%
UNEMPLOYMENT AMONG WOMEN WITH CHILDREN AGES 6 TO 17 YEARS
2.1/ 100
METRIC RATING
242nd/ 347
METRIC RANK
Immigrants from Southern Europe vs Immigrants from Colombia Unemployment Among Women with Children Ages 6 to 17 years Correlation Chart
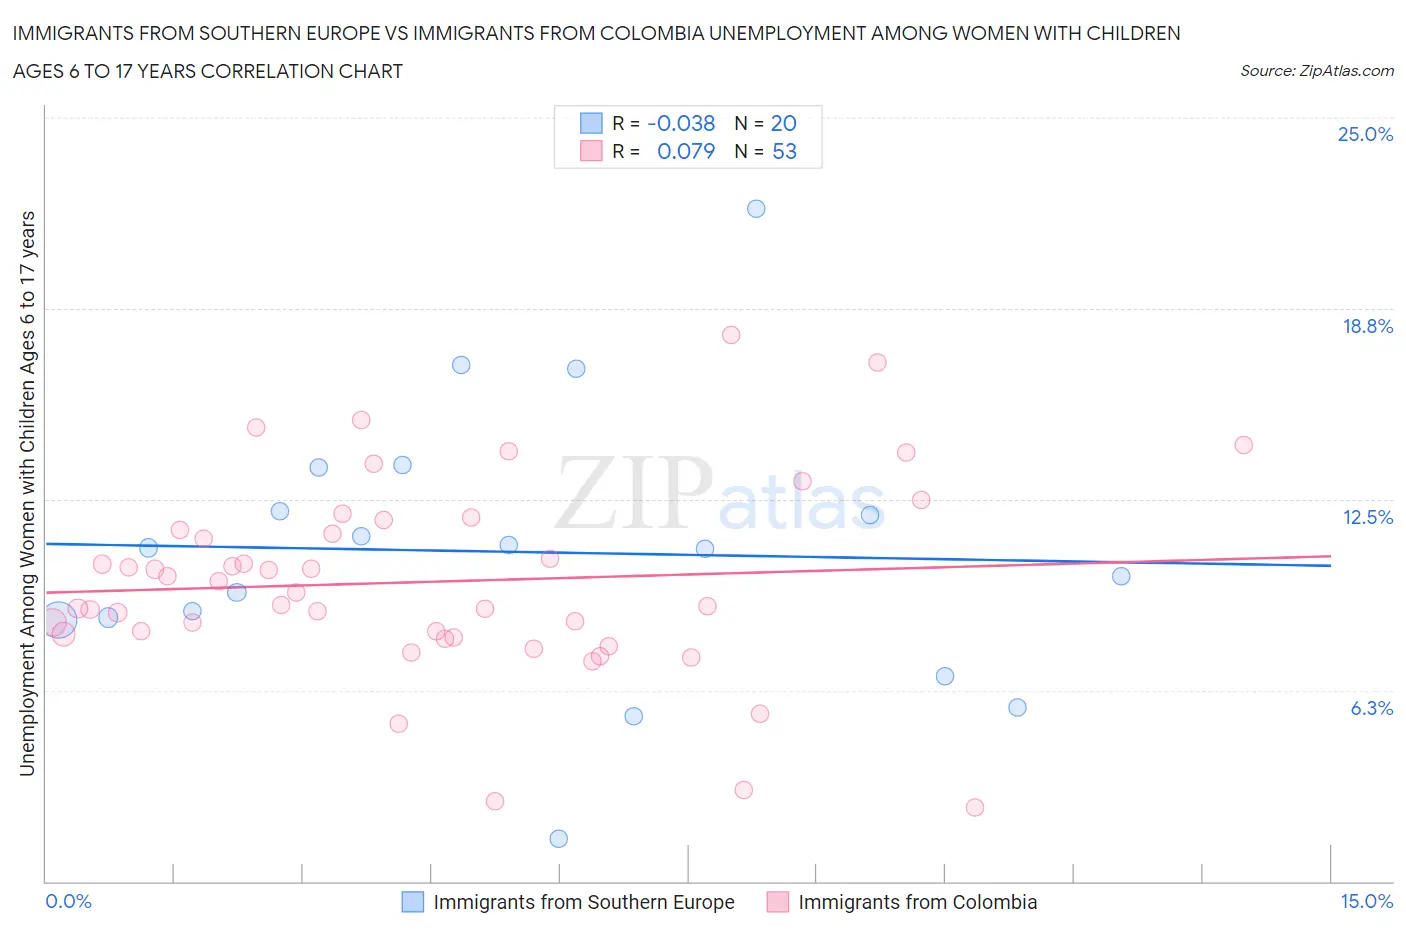
The statistical analysis conducted on geographies consisting of 285,916,862 people shows no correlation between the proportion of Immigrants from Southern Europe and unemployment rate among women with children between the ages 6 and 17 in the United States with a correlation coefficient (R) of -0.038 and weighted average of 9.2%. Similarly, the statistical analysis conducted on geographies consisting of 278,056,309 people shows a slight positive correlation between the proportion of Immigrants from Colombia and unemployment rate among women with children between the ages 6 and 17 in the United States with a correlation coefficient (R) of 0.079 and weighted average of 9.3%, a difference of 1.1%.
Unemployment Among Women with Children Ages 6 to 17 years Correlation Summary
| Measurement | Immigrants from Southern Europe | Immigrants from Colombia |
| Minimum | 1.4% | 2.4% |
| Maximum | 22.0% | 17.9% |
| Range | 20.6% | 15.5% |
| Mean | 10.8% | 9.8% |
| Median | 10.9% | 9.4% |
| Interquartile 25% (IQ1) | 8.6% | 8.0% |
| Interquartile 75% (IQ3) | 12.8% | 11.6% |
| Interquartile Range (IQR) | 4.2% | 3.6% |
| Standard Deviation (Sample) | 4.6% | 3.2% |
| Standard Deviation (Population) | 4.4% | 3.2% |
Demographics Similar to Immigrants from Southern Europe and Immigrants from Colombia by Unemployment Among Women with Children Ages 6 to 17 years
In terms of unemployment among women with children ages 6 to 17 years, the demographic groups most similar to Immigrants from Southern Europe are Immigrants from Eritrea (9.2%, a difference of 0.010%), Immigrants from El Salvador (9.3%, a difference of 0.11%), Chinese (9.3%, a difference of 0.12%), Immigrants from the Azores (9.3%, a difference of 0.26%), and Panamanian (9.3%, a difference of 0.29%). Similarly, the demographic groups most similar to Immigrants from Colombia are Colombian (9.3%, a difference of 0.020%), Guatemalan (9.3%, a difference of 0.090%), Arab (9.3%, a difference of 0.23%), Immigrants from Saudi Arabia (9.3%, a difference of 0.23%), and Immigrants from Belize (9.3%, a difference of 0.31%).
| Demographics | Rating | Rank | Unemployment Among Women with Children Ages 6 to 17 years |
| Immigrants | Southern Europe | 5.8 /100 | #222 | Tragic 9.2% |
| Immigrants | Eritrea | 5.8 /100 | #223 | Tragic 9.2% |
| Immigrants | El Salvador | 5.3 /100 | #224 | Tragic 9.3% |
| Chinese | 5.2 /100 | #225 | Tragic 9.3% |
| Immigrants | Azores | 4.6 /100 | #226 | Tragic 9.3% |
| Panamanians | 4.5 /100 | #227 | Tragic 9.3% |
| Estonians | 4.4 /100 | #228 | Tragic 9.3% |
| Lumbee | 4.3 /100 | #229 | Tragic 9.3% |
| Welsh | 4.0 /100 | #230 | Tragic 9.3% |
| Macedonians | 3.9 /100 | #231 | Tragic 9.3% |
| French American Indians | 3.7 /100 | #232 | Tragic 9.3% |
| Immigrants | St. Vincent and the Grenadines | 3.3 /100 | #233 | Tragic 9.3% |
| Mexicans | 3.2 /100 | #234 | Tragic 9.3% |
| Uruguayans | 3.0 /100 | #235 | Tragic 9.3% |
| Hungarians | 3.0 /100 | #236 | Tragic 9.3% |
| Immigrants | Belize | 2.8 /100 | #237 | Tragic 9.3% |
| Arabs | 2.7 /100 | #238 | Tragic 9.3% |
| Immigrants | Saudi Arabia | 2.7 /100 | #239 | Tragic 9.3% |
| Guatemalans | 2.3 /100 | #240 | Tragic 9.3% |
| Colombians | 2.2 /100 | #241 | Tragic 9.3% |
| Immigrants | Colombia | 2.1 /100 | #242 | Tragic 9.3% |