Immigrants from Southern Europe vs Guamanian/Chamorro Unemployment Among Seniors over 75 years
COMPARE
Immigrants from Southern Europe
Guamanian/Chamorro
Unemployment Among Seniors over 75 years
Unemployment Among Seniors over 75 years Comparison
Immigrants from Southern Europe
Guamanians/Chamorros
9.2%
UNEMPLOYMENT AMONG SENIORS OVER 75 YEARS
2.8/ 100
METRIC RATING
241st/ 347
METRIC RANK
9.0%
UNEMPLOYMENT AMONG SENIORS OVER 75 YEARS
7.7/ 100
METRIC RATING
221st/ 347
METRIC RANK
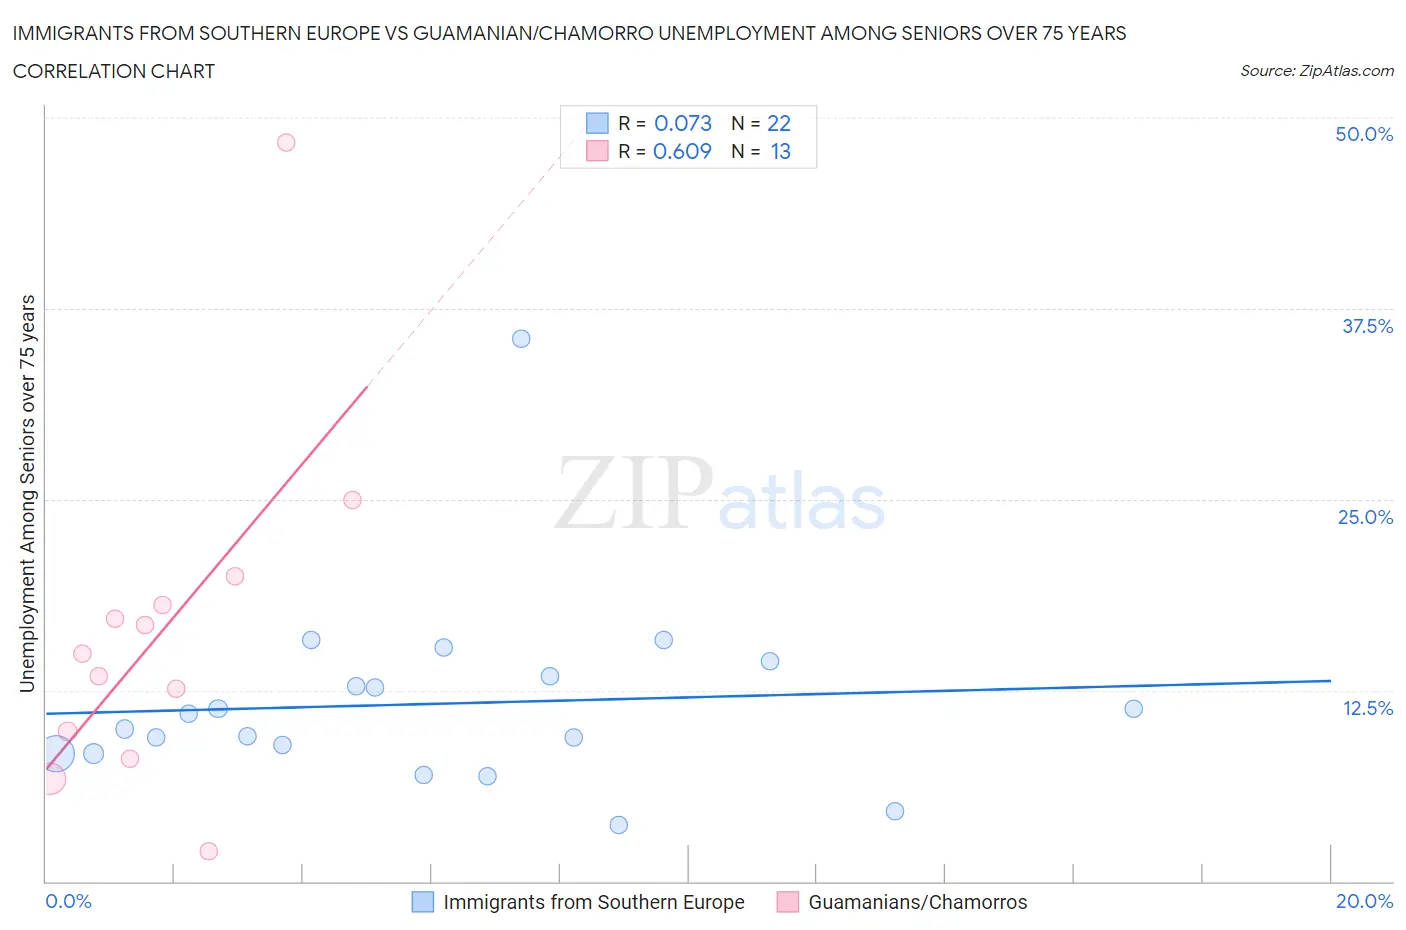
Immigrants from Southern Europe vs Guamanian/Chamorro Unemployment Among Seniors over 75 years Correlation Chart
The statistical analysis conducted on geographies consisting of 205,118,001 people shows a slight positive correlation between the proportion of Immigrants from Southern Europe and unemployment rate among seniors over the age of 75 in the United States with a correlation coefficient (R) of 0.073 and weighted average of 9.2%. Similarly, the statistical analysis conducted on geographies consisting of 136,667,243 people shows a significant positive correlation between the proportion of Guamanians/Chamorros and unemployment rate among seniors over the age of 75 in the United States with a correlation coefficient (R) of 0.609 and weighted average of 9.0%, a difference of 1.3%.
Unemployment Among Seniors over 75 years Correlation Summary
| Measurement | Immigrants from Southern Europe | Guamanian/Chamorro |
| Minimum | 3.7% | 2.0% |
| Maximum | 35.5% | 48.4% |
| Range | 31.8% | 46.4% |
| Mean | 11.6% | 16.4% |
| Median | 10.5% | 14.9% |
| Interquartile 25% (IQ1) | 8.4% | 8.9% |
| Interquartile 75% (IQ3) | 13.4% | 19.0% |
| Interquartile Range (IQR) | 5.0% | 10.1% |
| Standard Deviation (Sample) | 6.3% | 11.4% |
| Standard Deviation (Population) | 6.2% | 10.9% |
Demographics Similar to Immigrants from Southern Europe and Guamanians/Chamorros by Unemployment Among Seniors over 75 years
In terms of unemployment among seniors over 75 years, the demographic groups most similar to Immigrants from Southern Europe are Spanish (9.1%, a difference of 0.21%), Mexican (9.1%, a difference of 0.26%), Inupiat (9.1%, a difference of 0.31%), Houma (9.1%, a difference of 0.41%), and Jordanian (9.1%, a difference of 0.44%). Similarly, the demographic groups most similar to Guamanians/Chamorros are Peruvian (9.0%, a difference of 0.070%), Immigrants from Jordan (9.0%, a difference of 0.14%), Costa Rican (9.1%, a difference of 0.27%), Navajo (9.1%, a difference of 0.32%), and Immigrants from Bangladesh (9.1%, a difference of 0.37%).
| Demographics | Rating | Rank | Unemployment Among Seniors over 75 years |
| Guamanians/Chamorros | 7.7 /100 | #221 | Tragic 9.0% |
| Peruvians | 7.3 /100 | #222 | Tragic 9.0% |
| Immigrants | Jordan | 6.9 /100 | #223 | Tragic 9.0% |
| Costa Ricans | 6.3 /100 | #224 | Tragic 9.1% |
| Navajo | 6.1 /100 | #225 | Tragic 9.1% |
| Immigrants | Bangladesh | 5.9 /100 | #226 | Tragic 9.1% |
| Samoans | 5.7 /100 | #227 | Tragic 9.1% |
| Kenyans | 5.4 /100 | #228 | Tragic 9.1% |
| Hispanics or Latinos | 5.0 /100 | #229 | Tragic 9.1% |
| Northern Europeans | 4.9 /100 | #230 | Tragic 9.1% |
| Immigrants | Central America | 4.9 /100 | #231 | Tragic 9.1% |
| Africans | 4.9 /100 | #232 | Tragic 9.1% |
| Yugoslavians | 4.8 /100 | #233 | Tragic 9.1% |
| Vietnamese | 4.6 /100 | #234 | Tragic 9.1% |
| Panamanians | 4.0 /100 | #235 | Tragic 9.1% |
| Jordanians | 4.0 /100 | #236 | Tragic 9.1% |
| Houma | 3.9 /100 | #237 | Tragic 9.1% |
| Inupiat | 3.6 /100 | #238 | Tragic 9.1% |
| Mexicans | 3.5 /100 | #239 | Tragic 9.1% |
| Spanish | 3.3 /100 | #240 | Tragic 9.1% |
| Immigrants | Southern Europe | 2.8 /100 | #241 | Tragic 9.2% |