Czech vs Guamanian/Chamorro Unemployment Among Seniors over 75 years
COMPARE
Czech
Guamanian/Chamorro
Unemployment Among Seniors over 75 years
Unemployment Among Seniors over 75 years Comparison
Czechs
Guamanians/Chamorros
9.7%
UNEMPLOYMENT AMONG SENIORS OVER 75 YEARS
0.0/ 100
METRIC RATING
289th/ 347
METRIC RANK
9.0%
UNEMPLOYMENT AMONG SENIORS OVER 75 YEARS
7.7/ 100
METRIC RATING
221st/ 347
METRIC RANK
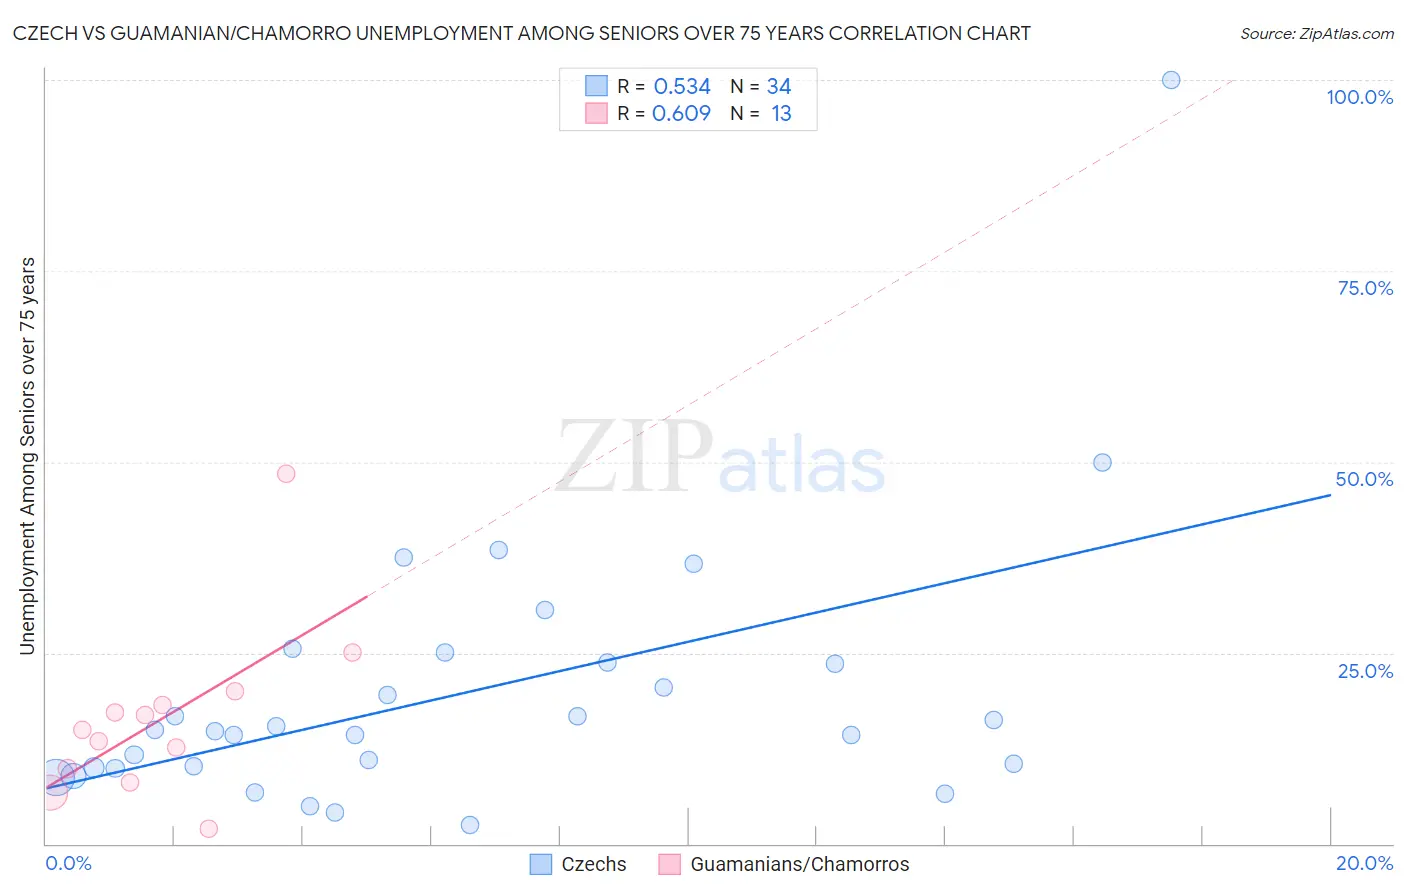
Czech vs Guamanian/Chamorro Unemployment Among Seniors over 75 years Correlation Chart
The statistical analysis conducted on geographies consisting of 219,317,722 people shows a substantial positive correlation between the proportion of Czechs and unemployment rate among seniors over the age of 75 in the United States with a correlation coefficient (R) of 0.534 and weighted average of 9.7%. Similarly, the statistical analysis conducted on geographies consisting of 136,667,243 people shows a significant positive correlation between the proportion of Guamanians/Chamorros and unemployment rate among seniors over the age of 75 in the United States with a correlation coefficient (R) of 0.609 and weighted average of 9.0%, a difference of 7.4%.
Unemployment Among Seniors over 75 years Correlation Summary
| Measurement | Czech | Guamanian/Chamorro |
| Minimum | 2.4% | 2.0% |
| Maximum | 100.0% | 48.4% |
| Range | 97.6% | 46.4% |
| Mean | 19.8% | 16.4% |
| Median | 14.8% | 14.9% |
| Interquartile 25% (IQ1) | 9.9% | 8.9% |
| Interquartile 75% (IQ3) | 23.8% | 19.0% |
| Interquartile Range (IQR) | 13.9% | 10.1% |
| Standard Deviation (Sample) | 17.9% | 11.4% |
| Standard Deviation (Population) | 17.6% | 10.9% |
Similar Demographics by Unemployment Among Seniors over 75 years
Demographics Similar to Czechs by Unemployment Among Seniors over 75 years
In terms of unemployment among seniors over 75 years, the demographic groups most similar to Czechs are Sioux (9.7%, a difference of 0.070%), Canadian (9.7%, a difference of 0.080%), Danish (9.7%, a difference of 0.22%), Nigerian (9.7%, a difference of 0.33%), and Carpatho Rusyn (9.7%, a difference of 0.39%).
| Demographics | Rating | Rank | Unemployment Among Seniors over 75 years |
| Macedonians | 0.0 /100 | #282 | Tragic 9.6% |
| Immigrants | Nigeria | 0.0 /100 | #283 | Tragic 9.6% |
| Europeans | 0.0 /100 | #284 | Tragic 9.7% |
| Carpatho Rusyns | 0.0 /100 | #285 | Tragic 9.7% |
| Nigerians | 0.0 /100 | #286 | Tragic 9.7% |
| Danes | 0.0 /100 | #287 | Tragic 9.7% |
| Canadians | 0.0 /100 | #288 | Tragic 9.7% |
| Czechs | 0.0 /100 | #289 | Tragic 9.7% |
| Sioux | 0.0 /100 | #290 | Tragic 9.7% |
| Scandinavians | 0.0 /100 | #291 | Tragic 9.7% |
| Immigrants | Western Africa | 0.0 /100 | #292 | Tragic 9.8% |
| Norwegians | 0.0 /100 | #293 | Tragic 9.8% |
| Immigrants | Dominica | 0.0 /100 | #294 | Tragic 9.8% |
| Immigrants | Nonimmigrants | 0.0 /100 | #295 | Tragic 9.8% |
| Immigrants | St. Vincent and the Grenadines | 0.0 /100 | #296 | Tragic 9.8% |
Demographics Similar to Guamanians/Chamorros by Unemployment Among Seniors over 75 years
In terms of unemployment among seniors over 75 years, the demographic groups most similar to Guamanians/Chamorros are Immigrants from Zimbabwe (9.0%, a difference of 0.020%), Peruvian (9.0%, a difference of 0.070%), Afghan (9.0%, a difference of 0.10%), Immigrants from Jordan (9.0%, a difference of 0.14%), and Costa Rican (9.1%, a difference of 0.27%).
| Demographics | Rating | Rank | Unemployment Among Seniors over 75 years |
| Immigrants | Brazil | 13.3 /100 | #214 | Poor 9.0% |
| Immigrants | Western Asia | 12.5 /100 | #215 | Poor 9.0% |
| Immigrants | Oceania | 11.8 /100 | #216 | Poor 9.0% |
| Lebanese | 11.1 /100 | #217 | Poor 9.0% |
| Immigrants | Africa | 9.7 /100 | #218 | Tragic 9.0% |
| Afghans | 8.3 /100 | #219 | Tragic 9.0% |
| Immigrants | Zimbabwe | 7.8 /100 | #220 | Tragic 9.0% |
| Guamanians/Chamorros | 7.7 /100 | #221 | Tragic 9.0% |
| Peruvians | 7.3 /100 | #222 | Tragic 9.0% |
| Immigrants | Jordan | 6.9 /100 | #223 | Tragic 9.0% |
| Costa Ricans | 6.3 /100 | #224 | Tragic 9.1% |
| Navajo | 6.1 /100 | #225 | Tragic 9.1% |
| Immigrants | Bangladesh | 5.9 /100 | #226 | Tragic 9.1% |
| Samoans | 5.7 /100 | #227 | Tragic 9.1% |
| Kenyans | 5.4 /100 | #228 | Tragic 9.1% |