Immigrants from Southern Europe vs Fijian Unemployment Among Seniors over 75 years
COMPARE
Immigrants from Southern Europe
Fijian
Unemployment Among Seniors over 75 years
Unemployment Among Seniors over 75 years Comparison
Immigrants from Southern Europe
Fijians
9.2%
UNEMPLOYMENT AMONG SENIORS OVER 75 YEARS
2.8/ 100
METRIC RATING
241st/ 347
METRIC RANK
8.7%
UNEMPLOYMENT AMONG SENIORS OVER 75 YEARS
56.4/ 100
METRIC RATING
169th/ 347
METRIC RANK
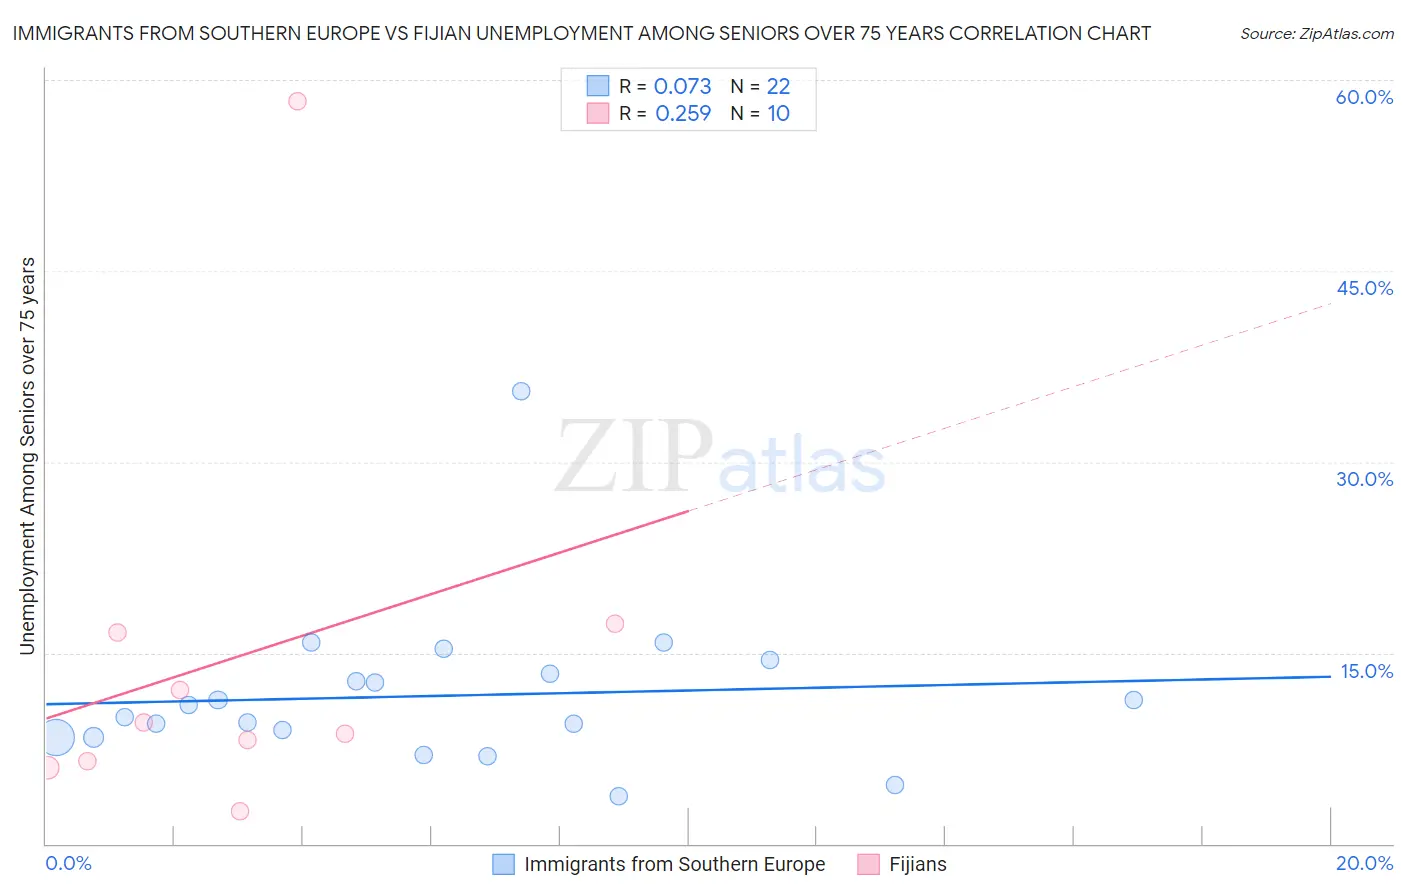
Immigrants from Southern Europe vs Fijian Unemployment Among Seniors over 75 years Correlation Chart
The statistical analysis conducted on geographies consisting of 205,118,001 people shows a slight positive correlation between the proportion of Immigrants from Southern Europe and unemployment rate among seniors over the age of 75 in the United States with a correlation coefficient (R) of 0.073 and weighted average of 9.2%. Similarly, the statistical analysis conducted on geographies consisting of 43,656,778 people shows a weak positive correlation between the proportion of Fijians and unemployment rate among seniors over the age of 75 in the United States with a correlation coefficient (R) of 0.259 and weighted average of 8.7%, a difference of 5.1%.
Unemployment Among Seniors over 75 years Correlation Summary
| Measurement | Immigrants from Southern Europe | Fijian |
| Minimum | 3.7% | 2.6% |
| Maximum | 35.5% | 58.3% |
| Range | 31.8% | 55.7% |
| Mean | 11.6% | 14.6% |
| Median | 10.5% | 9.1% |
| Interquartile 25% (IQ1) | 8.4% | 6.5% |
| Interquartile 75% (IQ3) | 13.4% | 16.6% |
| Interquartile Range (IQR) | 5.0% | 10.2% |
| Standard Deviation (Sample) | 6.3% | 16.0% |
| Standard Deviation (Population) | 6.2% | 15.2% |
Similar Demographics by Unemployment Among Seniors over 75 years
Demographics Similar to Immigrants from Southern Europe by Unemployment Among Seniors over 75 years
In terms of unemployment among seniors over 75 years, the demographic groups most similar to Immigrants from Southern Europe are Sierra Leonean (9.2%, a difference of 0.030%), Slavic (9.2%, a difference of 0.030%), Immigrants from Germany (9.2%, a difference of 0.060%), Immigrants from Canada (9.2%, a difference of 0.12%), and Spanish (9.1%, a difference of 0.21%).
| Demographics | Rating | Rank | Unemployment Among Seniors over 75 years |
| Vietnamese | 4.6 /100 | #234 | Tragic 9.1% |
| Panamanians | 4.0 /100 | #235 | Tragic 9.1% |
| Jordanians | 4.0 /100 | #236 | Tragic 9.1% |
| Houma | 3.9 /100 | #237 | Tragic 9.1% |
| Inupiat | 3.6 /100 | #238 | Tragic 9.1% |
| Mexicans | 3.5 /100 | #239 | Tragic 9.1% |
| Spanish | 3.3 /100 | #240 | Tragic 9.1% |
| Immigrants | Southern Europe | 2.8 /100 | #241 | Tragic 9.2% |
| Sierra Leoneans | 2.8 /100 | #242 | Tragic 9.2% |
| Slavs | 2.8 /100 | #243 | Tragic 9.2% |
| Immigrants | Germany | 2.7 /100 | #244 | Tragic 9.2% |
| Immigrants | Canada | 2.6 /100 | #245 | Tragic 9.2% |
| Immigrants | North America | 2.4 /100 | #246 | Tragic 9.2% |
| Sub-Saharan Africans | 2.3 /100 | #247 | Tragic 9.2% |
| Blackfeet | 2.3 /100 | #248 | Tragic 9.2% |
Demographics Similar to Fijians by Unemployment Among Seniors over 75 years
In terms of unemployment among seniors over 75 years, the demographic groups most similar to Fijians are Immigrants from Lithuania (8.7%, a difference of 0.040%), Immigrants from Eastern Africa (8.7%, a difference of 0.060%), Immigrants from Belize (8.7%, a difference of 0.070%), Zimbabwean (8.7%, a difference of 0.13%), and Dominican (8.7%, a difference of 0.25%).
| Demographics | Rating | Rank | Unemployment Among Seniors over 75 years |
| Immigrants | South America | 71.3 /100 | #162 | Good 8.6% |
| Immigrants | Guatemala | 68.4 /100 | #163 | Good 8.7% |
| Paraguayans | 62.2 /100 | #164 | Good 8.7% |
| Immigrants | Dominican Republic | 61.4 /100 | #165 | Good 8.7% |
| Immigrants | Belize | 57.6 /100 | #166 | Average 8.7% |
| Immigrants | Eastern Africa | 57.6 /100 | #167 | Average 8.7% |
| Immigrants | Lithuania | 57.2 /100 | #168 | Average 8.7% |
| Fijians | 56.4 /100 | #169 | Average 8.7% |
| Zimbabweans | 54.1 /100 | #170 | Average 8.7% |
| Dominicans | 51.9 /100 | #171 | Average 8.7% |
| Immigrants | Immigrants | 51.8 /100 | #172 | Average 8.7% |
| Australians | 50.3 /100 | #173 | Average 8.7% |
| Immigrants | El Salvador | 49.7 /100 | #174 | Average 8.7% |
| Syrians | 49.6 /100 | #175 | Average 8.7% |
| Somalis | 45.3 /100 | #176 | Average 8.8% |