Immigrants from Southern Europe vs Fijian In Labor Force | Age > 16
COMPARE
Immigrants from Southern Europe
Fijian
In Labor Force | Age > 16
In Labor Force | Age > 16 Comparison
Immigrants from Southern Europe
Fijians
65.0%
IN LABOR FORCE | AGE > 16
31.3/ 100
METRIC RATING
194th/ 347
METRIC RANK
64.8%
IN LABOR FORCE | AGE > 16
14.1/ 100
METRIC RATING
211th/ 347
METRIC RANK
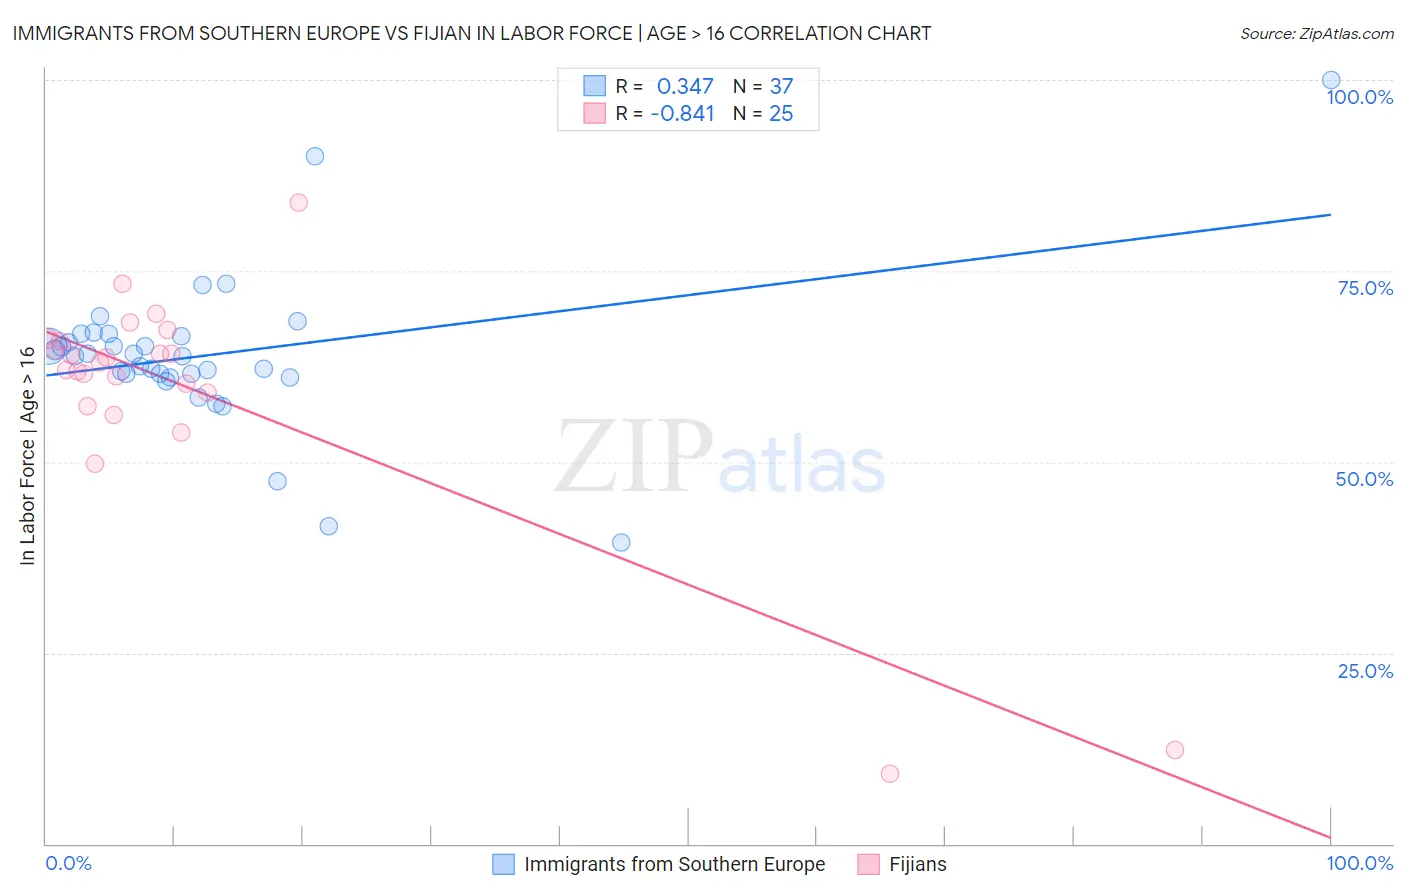
Immigrants from Southern Europe vs Fijian In Labor Force | Age > 16 Correlation Chart
The statistical analysis conducted on geographies consisting of 402,799,344 people shows a mild positive correlation between the proportion of Immigrants from Southern Europe and labor force participation rate among population ages 16 and over in the United States with a correlation coefficient (R) of 0.347 and weighted average of 65.0%. Similarly, the statistical analysis conducted on geographies consisting of 55,948,069 people shows a very strong negative correlation between the proportion of Fijians and labor force participation rate among population ages 16 and over in the United States with a correlation coefficient (R) of -0.841 and weighted average of 64.8%, a difference of 0.29%.
In Labor Force | Age > 16 Correlation Summary
| Measurement | Immigrants from Southern Europe | Fijian |
| Minimum | 39.5% | 9.1% |
| Maximum | 100.0% | 83.9% |
| Range | 60.5% | 74.8% |
| Mean | 64.0% | 59.3% |
| Median | 63.9% | 63.0% |
| Interquartile 25% (IQ1) | 61.3% | 58.2% |
| Interquartile 75% (IQ3) | 66.6% | 66.0% |
| Interquartile Range (IQR) | 5.2% | 7.7% |
| Standard Deviation (Sample) | 10.3% | 16.0% |
| Standard Deviation (Population) | 10.1% | 15.7% |
Demographics Similar to Immigrants from Southern Europe and Fijians by In Labor Force | Age > 16
In terms of in labor force | age > 16, the demographic groups most similar to Immigrants from Southern Europe are Romanian (65.0%, a difference of 0.0%), Haitian (65.0%, a difference of 0.010%), Immigrants from Fiji (65.0%, a difference of 0.030%), Immigrants from Europe (65.0%, a difference of 0.030%), and Immigrants from Italy (65.0%, a difference of 0.040%). Similarly, the demographic groups most similar to Fijians are Immigrants from Denmark (64.8%, a difference of 0.010%), Alaskan Athabascan (64.8%, a difference of 0.010%), Immigrants from Trinidad and Tobago (64.8%, a difference of 0.030%), Belizean (64.8%, a difference of 0.040%), and Immigrants from Latin America (64.8%, a difference of 0.050%).
| Demographics | Rating | Rank | In Labor Force | Age > 16 |
| Immigrants | Fiji | 33.7 /100 | #192 | Fair 65.0% |
| Immigrants | Europe | 33.6 /100 | #193 | Fair 65.0% |
| Immigrants | Southern Europe | 31.3 /100 | #194 | Fair 65.0% |
| Romanians | 31.1 /100 | #195 | Fair 65.0% |
| Haitians | 30.6 /100 | #196 | Fair 65.0% |
| Immigrants | Italy | 28.7 /100 | #197 | Fair 65.0% |
| Greeks | 26.1 /100 | #198 | Fair 64.9% |
| Mexican American Indians | 23.1 /100 | #199 | Fair 64.9% |
| Armenians | 20.2 /100 | #200 | Fair 64.9% |
| Ukrainians | 19.6 /100 | #201 | Poor 64.9% |
| Immigrants | Belgium | 19.4 /100 | #202 | Poor 64.9% |
| Russians | 18.8 /100 | #203 | Poor 64.9% |
| Slovenes | 18.7 /100 | #204 | Poor 64.9% |
| Jamaicans | 18.7 /100 | #205 | Poor 64.9% |
| Lithuanians | 17.4 /100 | #206 | Poor 64.8% |
| Immigrants | Latin America | 16.4 /100 | #207 | Poor 64.8% |
| Belizeans | 16.2 /100 | #208 | Poor 64.8% |
| Immigrants | Trinidad and Tobago | 15.6 /100 | #209 | Poor 64.8% |
| Immigrants | Denmark | 14.7 /100 | #210 | Poor 64.8% |
| Fijians | 14.1 /100 | #211 | Poor 64.8% |
| Alaskan Athabascans | 13.9 /100 | #212 | Poor 64.8% |